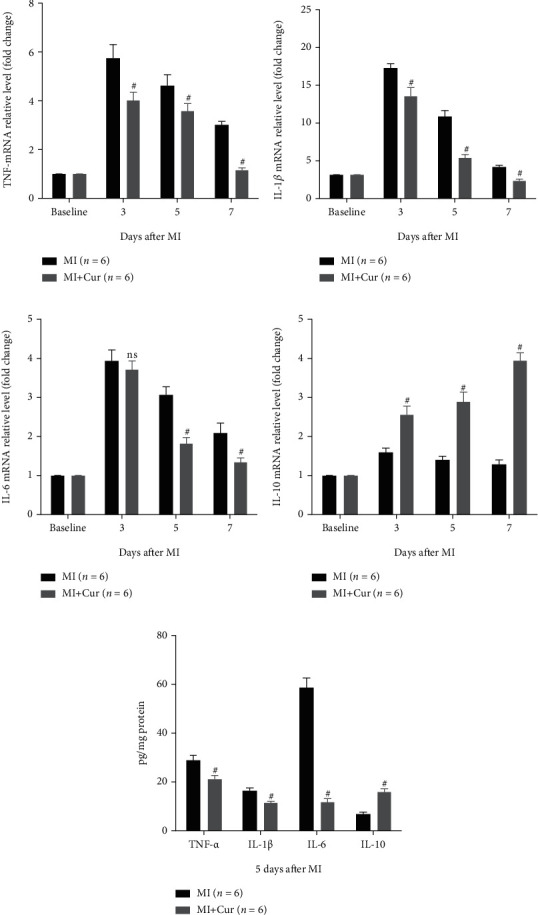
Figure 2.

Analysis of inflammation-related cytokine mRNA and protein expression in homogenized hearts. Data were shown as the mean ± SEM. # was P < 0.05, and ns was P > 0.05 vs. the MI group. And P value was calculated by Student's t-test. Baseline was defined as the gene expression in a normal mouse myocardium.
