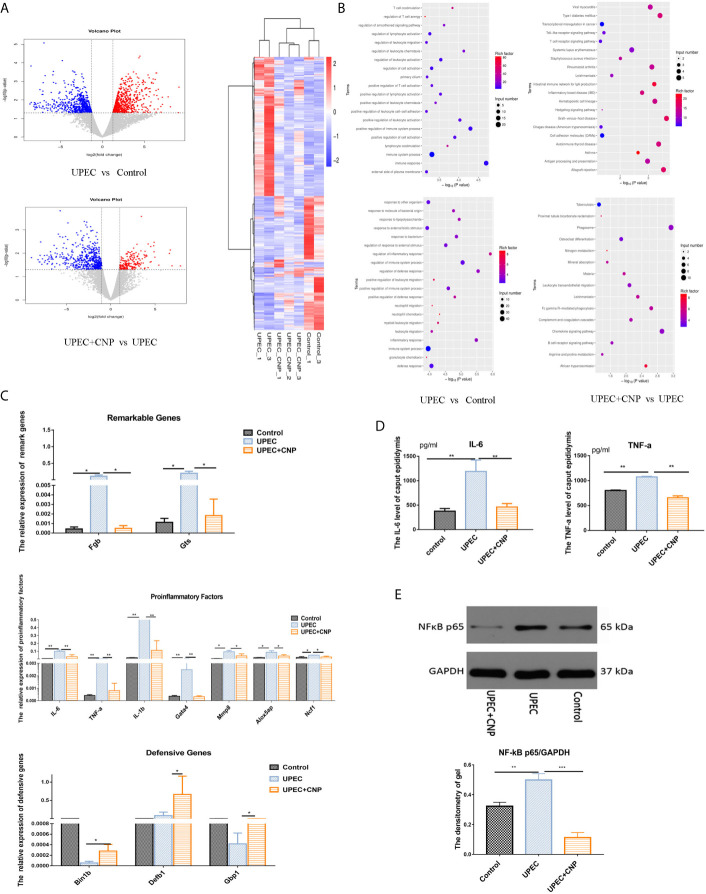
Figure 2.
RNA-seq sequencing and verification of genes. (A) Volcano graph and heatmap; blue represents downregulation, and red represents upregulation. (B) GO analysis and KEGG analysis between each group. (C) Gene verification with qPCR. (D) The content of IL-6 and TNF-a in caput epididymal fluid. (E) Expression level of NF-kB protein in caput epididymal tissue and was quantified in images. (mean ± SD, n = 3, *P < 0.05, **P < 0.01, ***P < 0.001).

