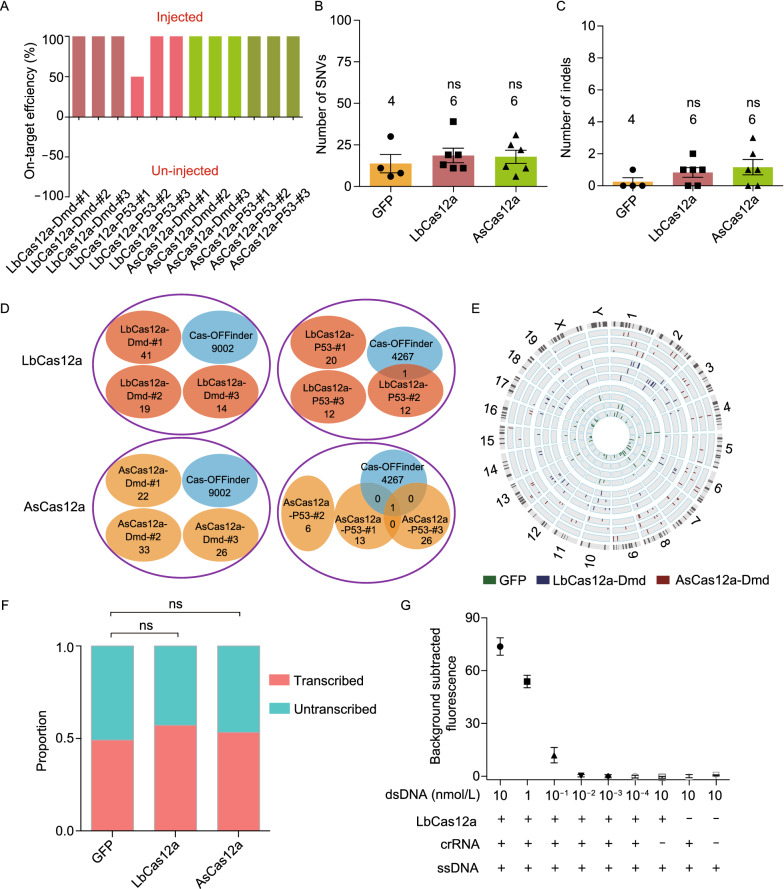
Figure 2.
On-target editing and off-target effects of LbCas12a and AsCas12a using GOAT. (A) On-target editing efficiency identified by WGS for LbCas12a and AsCas12a groups. (B) Number of SNVs identified in LbCas12a and AsCas12a groups by WGS, where on-target editing was removed from the analysis. (C) Number of indels identified in LbCas12a and AsCas12a groups by WGS. (D) Overlap among SNVs and indels detected by GOAT with predicted off-targets by Cas-OFFinder. (E) Distribution of SNVs in the mouse genome in GFP, LbCas12a-treated and AsCas12a-treated samples. Embryos from inner circle to outer circle were GFP-#1, GFP-#2, GFP-#3, LbCas12a-Dmd-#1, LbCas12a-Dmd-#2, LbCas12a-Dmd-#3, AsCas12a-Dmd-#1, AsCas12a-Dmd-#2 and AsCas12a-Dmd-#3. (F) The distribution of off-target SNVs in the transcribed and un-transcribed regions. P values were calculated by Chi-square test on the number of SNVs in transcribed and un-transcribed regions of each group. (G) Correlation between the target DNA dosage and the presence of cleaved ssDNA. n = 4 twins for GFP, n = 6 twins for LbCas12a and n = 6 twins for AsCas12a groups; numbers above the columns represent the number of samples. All values are presented as mean ± SEM. *P < 0.05, **P < 0.01, ***P < 0.001, ns, P ≥ 0.05, unpaired t-test. Note that samples of the GFP group are also used in Fig. 1

