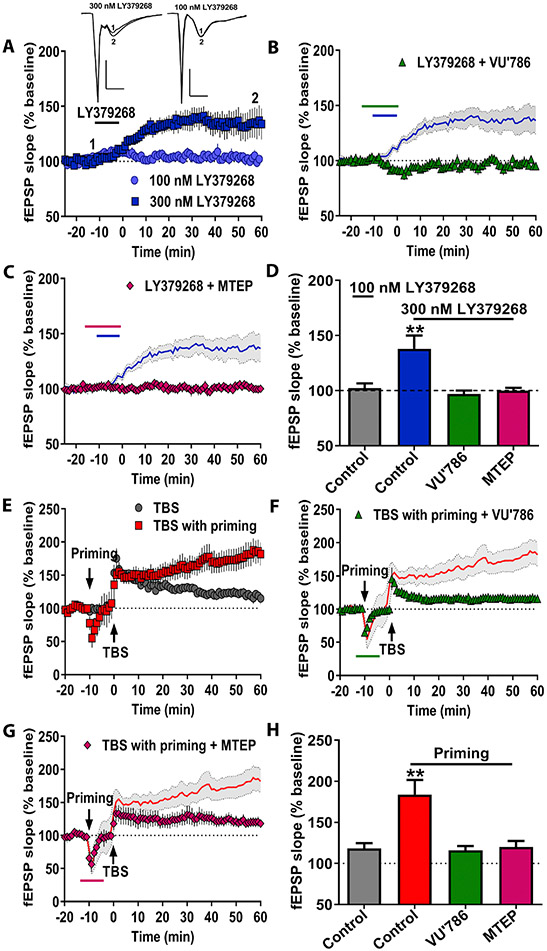
Figure 4. mGlu3 receptor signaling regulates multiple modes of LTP.
(A) A high concentration of LY379268 (300 nM) and sustained 0.5 Hz stimulation enhanced fEPSP slope in acute hippocampal slices (dark blue squares, n=6 slices). A modest concentration of LY379268 (100 nM) did not affect fEPSP slope on its own (light blue circles, n=8). Insets for (A) are representative fEPSP traces for the various experimental conditions measured during baseline (1) and 55 min post stimulation (2). Scale bars represent 1 mV and 50 ms for all traces. (B) The mGlu3 NAM VU0650786 (10 μM) blocked the fEPSP enhancement induced by LY379268 application (green triangles, n=5). Blue line displays LY379268 (300 nM) data from panel A. (C) The mGlu5 NAM MTEP (1 μM) blocked LY379268-induced LTP (pink diamonds, n=5). (D) Summary of averaged fEPSP slope of last 5 minutes of recordings from panels A-C (**p<0.01, compared to Control, F(3,20)=5.672, p<0.01 one-way ANOVA with Tukey’s post-hoc test). (E) Brief priming stimulation (2, 10-second, 10 Hz trains) followed by TBS (red squares, n=5) enhanced fEPSP slope compared to TBS alone (gray circles, n=5). (F) The mGlu3 NAM VU0650786 (10 μM) perfused before, during, and after priming stimulation blocked the enhanced LTP (green triangles, n=4). Red lines display TBS with priming data from panel E. (G) The mGlu5 NAM MTEP (1 μM) perfused throughout priming stimulation blocked the enhanced LTP (pink diamonds, n=4). (H) Summary of averaged fEPSP slope of last 5 minutes of recordings from E-G (**p<0.01, compared to Control, F(3,14)=9.136, p<0.01 one-way ANOVA with Tukey’s post-hoc test). Data are presented as mean ± SEM.

