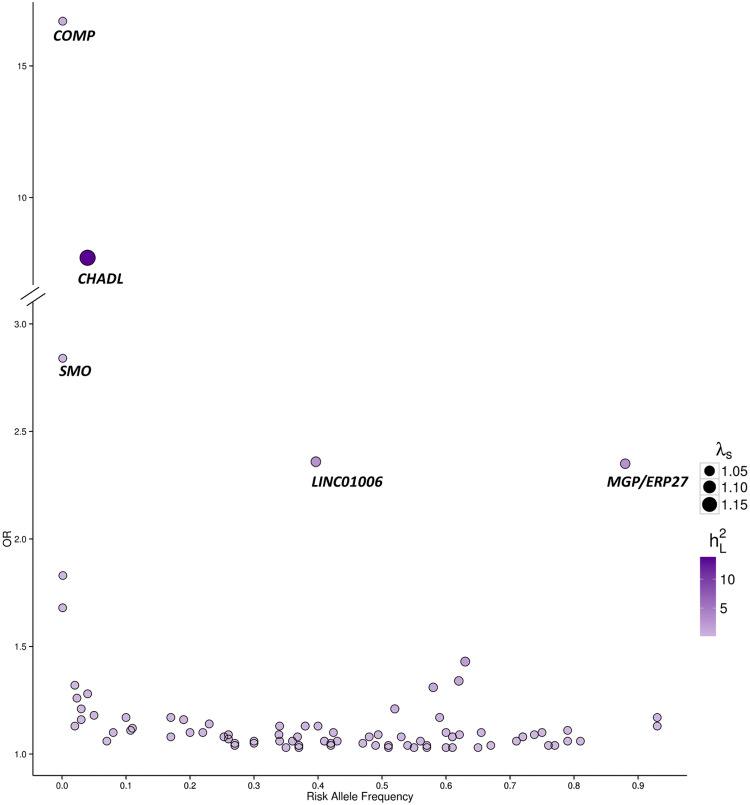
Fig. 6.
Effect size and risk allele frequency of published osteoarthritis genetic risk loci. Each circle represents a published osteoarthritis risk single-nucleotide variant plotted with its odds ratio (OR; y axis) as a function of the risk allele frequency (x-axis). The different size and colour of each circle shows the sibling relative risk ratio (λs) and the percentage of variance explained on the liability scale respectively (h2L; calculated assuming 13.5% prevalence of OA). Gene annotations are
taken from the Ensembl genome browser (human assembly GRCh37). The majority are common variants with small (OR < 2.0) effect sizes, only those with OR > 2.0 are named here

