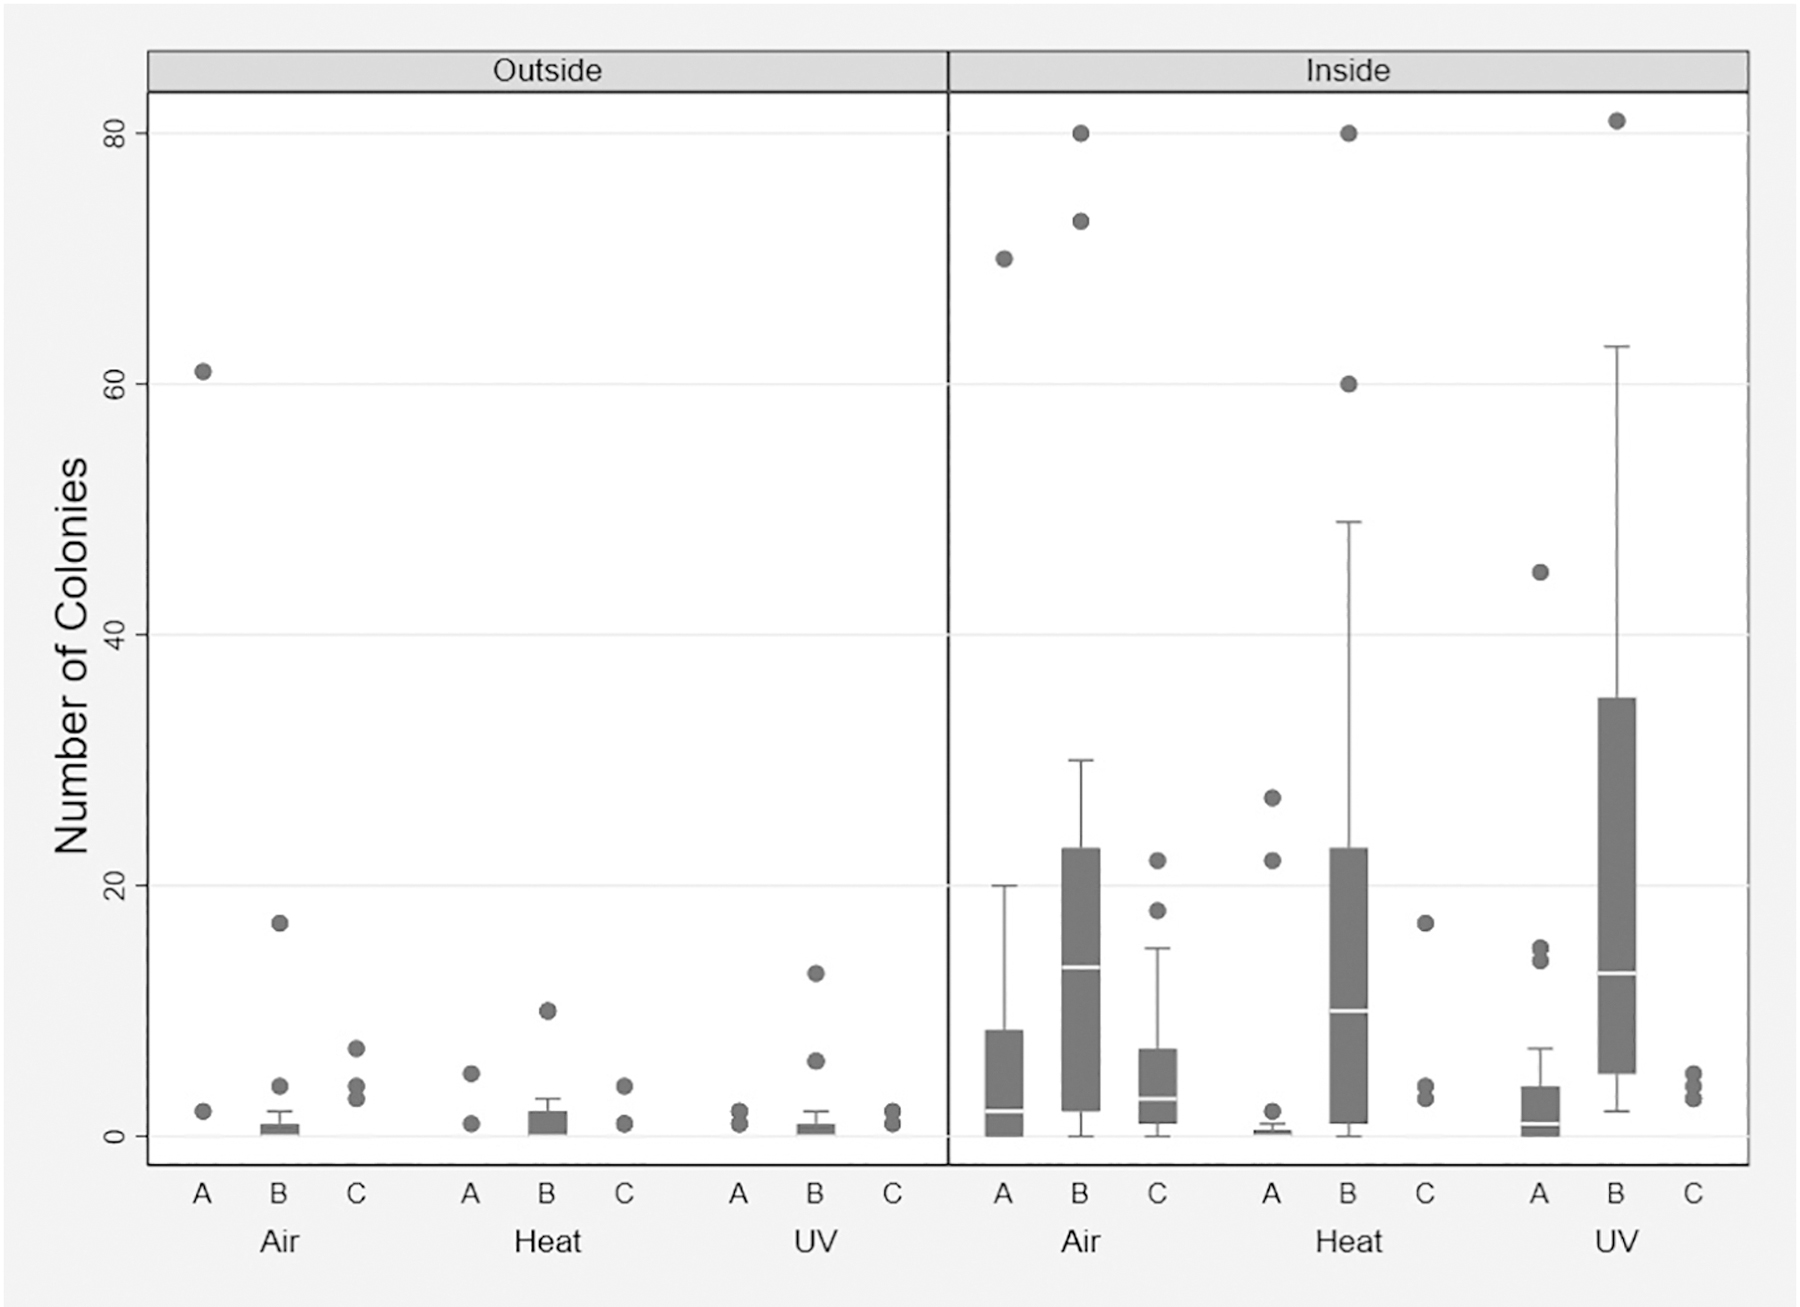
Figure 2. Box-and-whisker Plot of Bacterial Count.

Comparison of bacterial counts in each treatment arm on the inside and outside of the masks at different time points in the clinic cycle. A= pre-clinic; B = post-clinic; C = post-treatment

Comparison of bacterial counts in each treatment arm on the inside and outside of the masks at different time points in the clinic cycle. A= pre-clinic; B = post-clinic; C = post-treatment