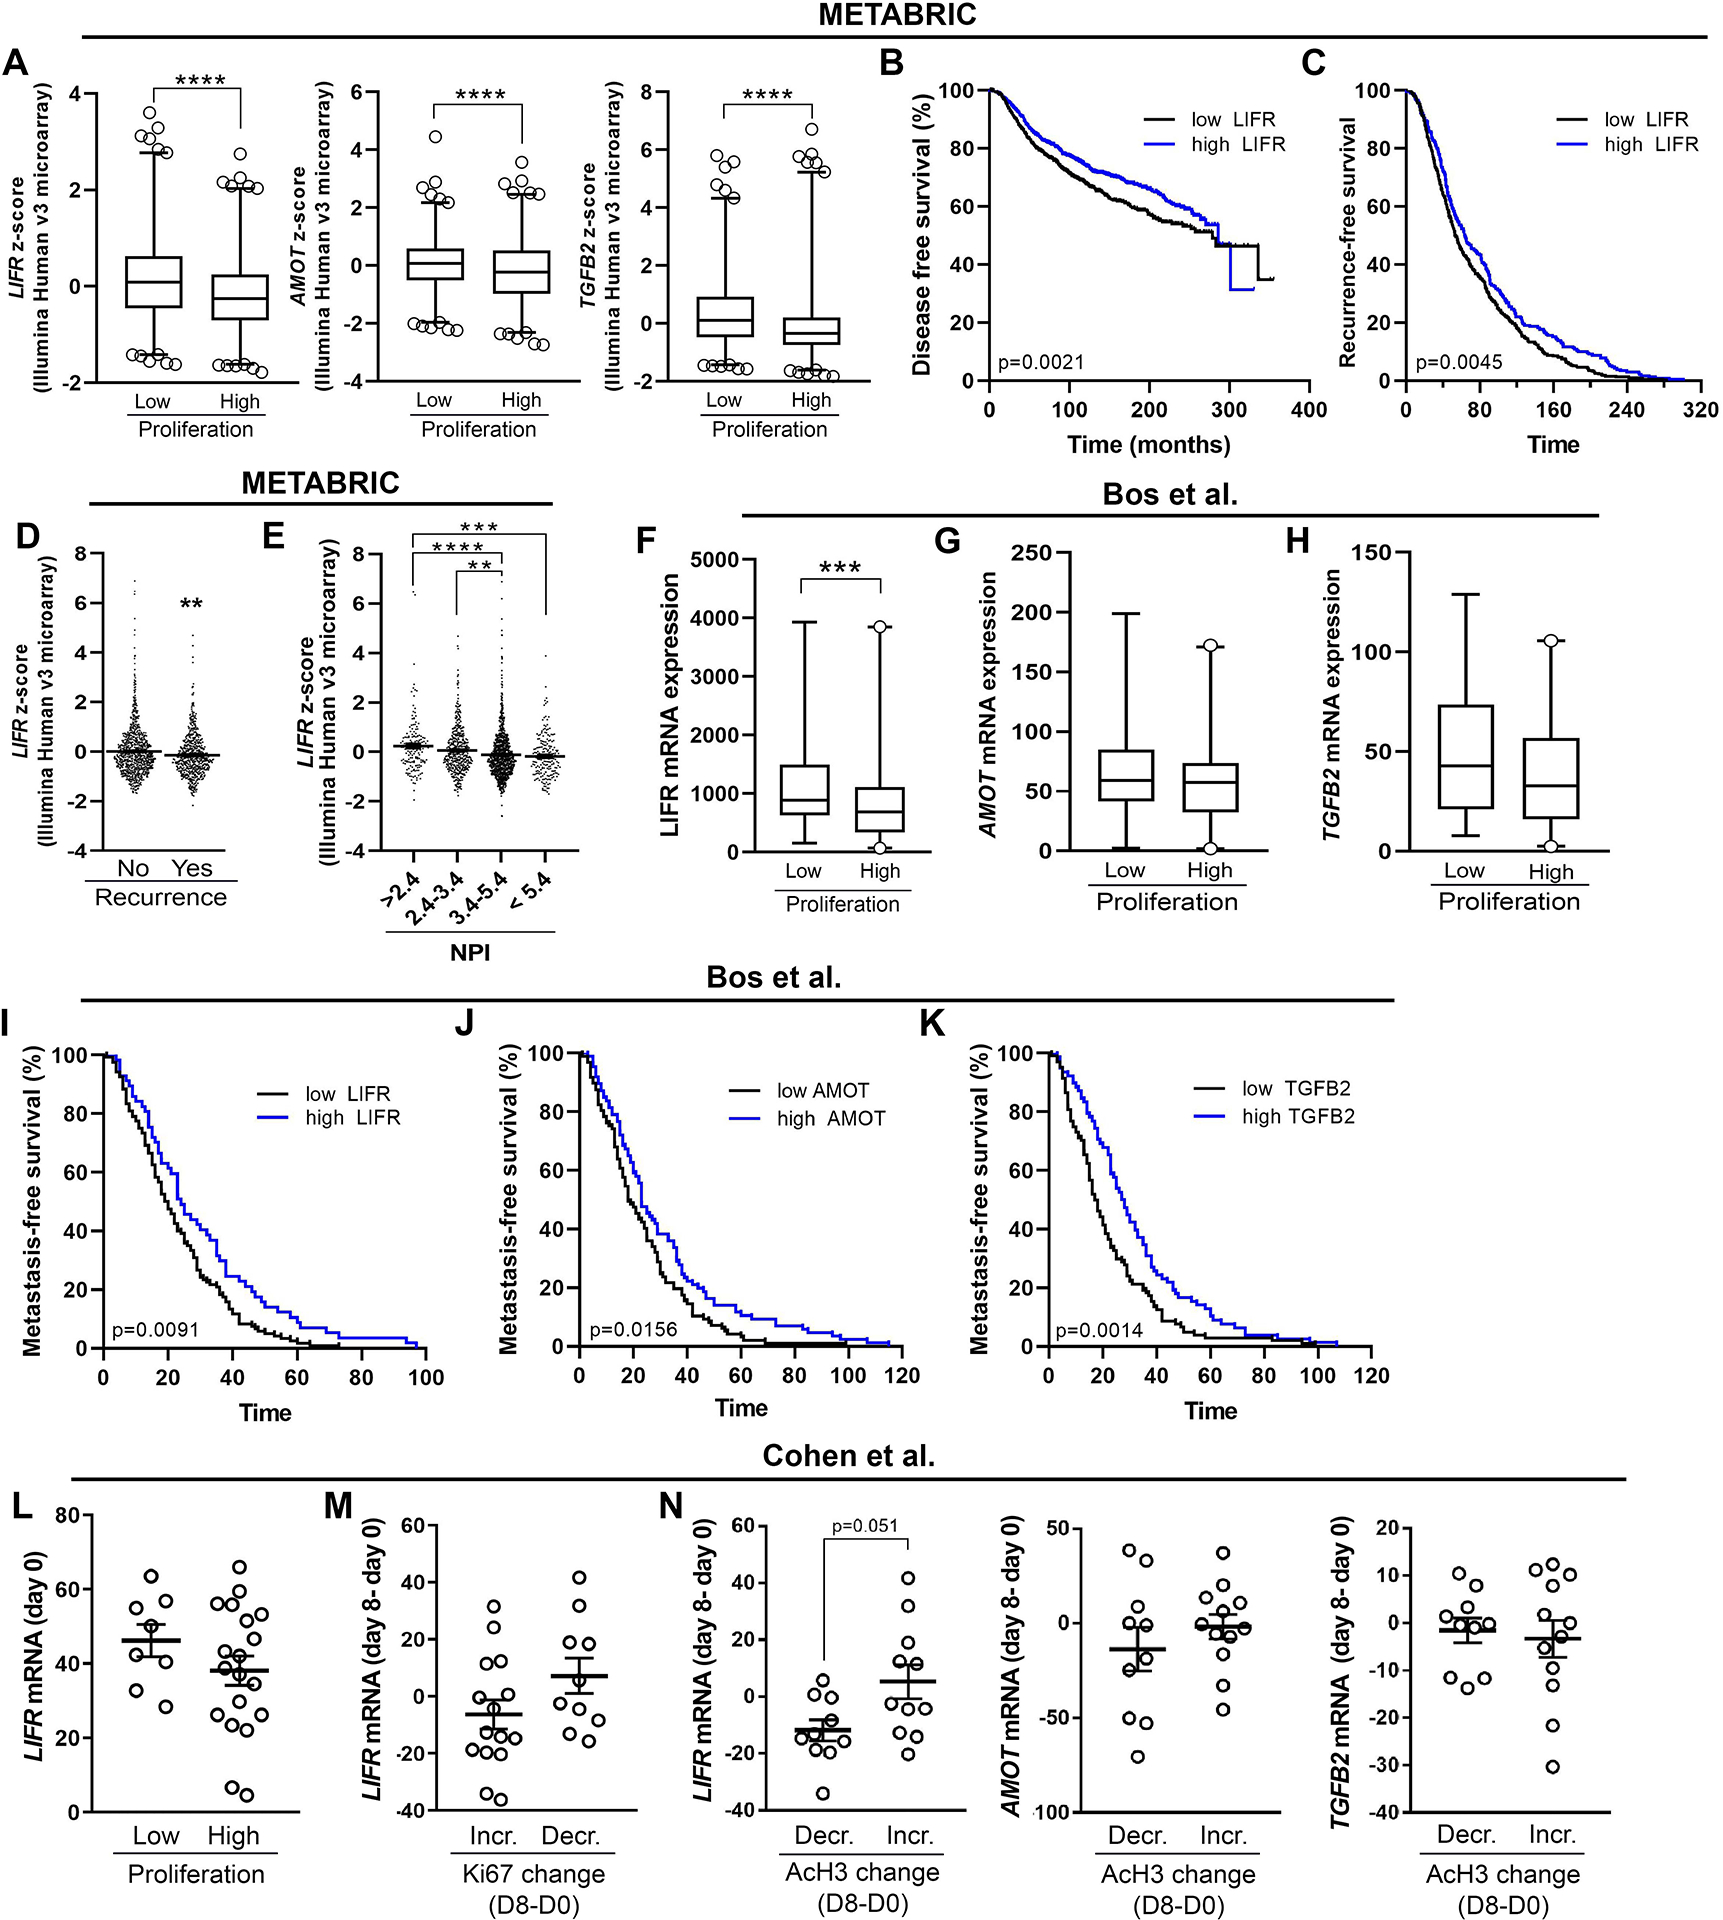
Figure 5. HDACi-induced dormancy phenotype is inversely associated with proliferation and recurrence in breast cancer patients.

(A) mRNA levels of LIFR, AMOT, and TGFB2 in ER+ breast tumors displaying low or high proliferation (low n=623, high n=603). The data are displayed as z-score values from Illumina Human v3 microarray data (METABRIC, Nature 2012 & Nat Commun 2016). (B) Survival analysis representing the proportion of disease-free patients stratified according to LIFR mRNA levels in samples from breast cancer patients (low n=979, high = 999; HR = 1.273; 95% CI: 1.091–1.486; METABRIC, Nature 2012 & Nat Commun 2016 dataset). (C) Analysis of time to recurrence in patients (HR = 1.262, 95% CI: 1.075–1.483) described in (B). (D) LIFR mRNA levels in breast cancer patients stratified by recurrence (no n=1278, yes n=622). The data are displayed as z-score values from Illumina Human v3 microarray data (METABRIC, Nature 2012 & Nat Commun 2016). (E) LIFR mRNA levels in breast tumors displaying low or high proliferation (low n= 86, high = 106; all breast cancer subtypes; Bos et al. dataset (GSE12276). (F, G) mRNA levels of (B) AMOT and (C) TGFB2 tumors displaying low or high proliferation. (H) LIFR mRNA levels in breast cancer patients stratified by Nottingham prognostic index (NPI) scores. The data are displayed as z-score values from Illumina Human v3 microarray data (METABRIC, Nature 2012 & Nat Commun 2016). (I-K) Survival analysis representing the proportion of relapse-free patients stratified according to (I) LIFR, (J) AMOT, or (K) TGFB2 mRNA levels in samples from breast cancer patients (LIFR (low n= 120, high = 57), (HR=1.486, 95% CI: 1.102–2.004)); AMOT (low = 97, high = 86), (HR=1.409, 95% CI: 1.052–1.885)); TGFB2 (low = 104, high = 78), (HR=1.583, 95% CI: 1.182–2.119); all breast cancer subtypes; Bos et al. dataset (GSE12276). (L) LIFR mRNA levels pre-treatment (day 0) in tumors displaying low and high proliferation (low n=8, high n=19). (M) LIFR mRNA expression change (day 8 – day 0) in tumors that displayed increased or decreased Ki67 levels post-treatment (day 8 – day 0) (low n=15, high = 10). (N) LIFR, AMOT, or TGFB2 mRNA expression change (day 8 – day 0) in patients that displayed increased or decreased acetylated histone H3 (AcH3) post-treatment (day 8 – day 0) (low n= 10, high n=12). A, D, E, N: Mann-Whitney t-test, H: One-way ANOVA with Sidak’s multiple comparisons test. *p<0.01, **p<0.01, ***p<0.001 and ****p<0.0001.
