Figure 5:


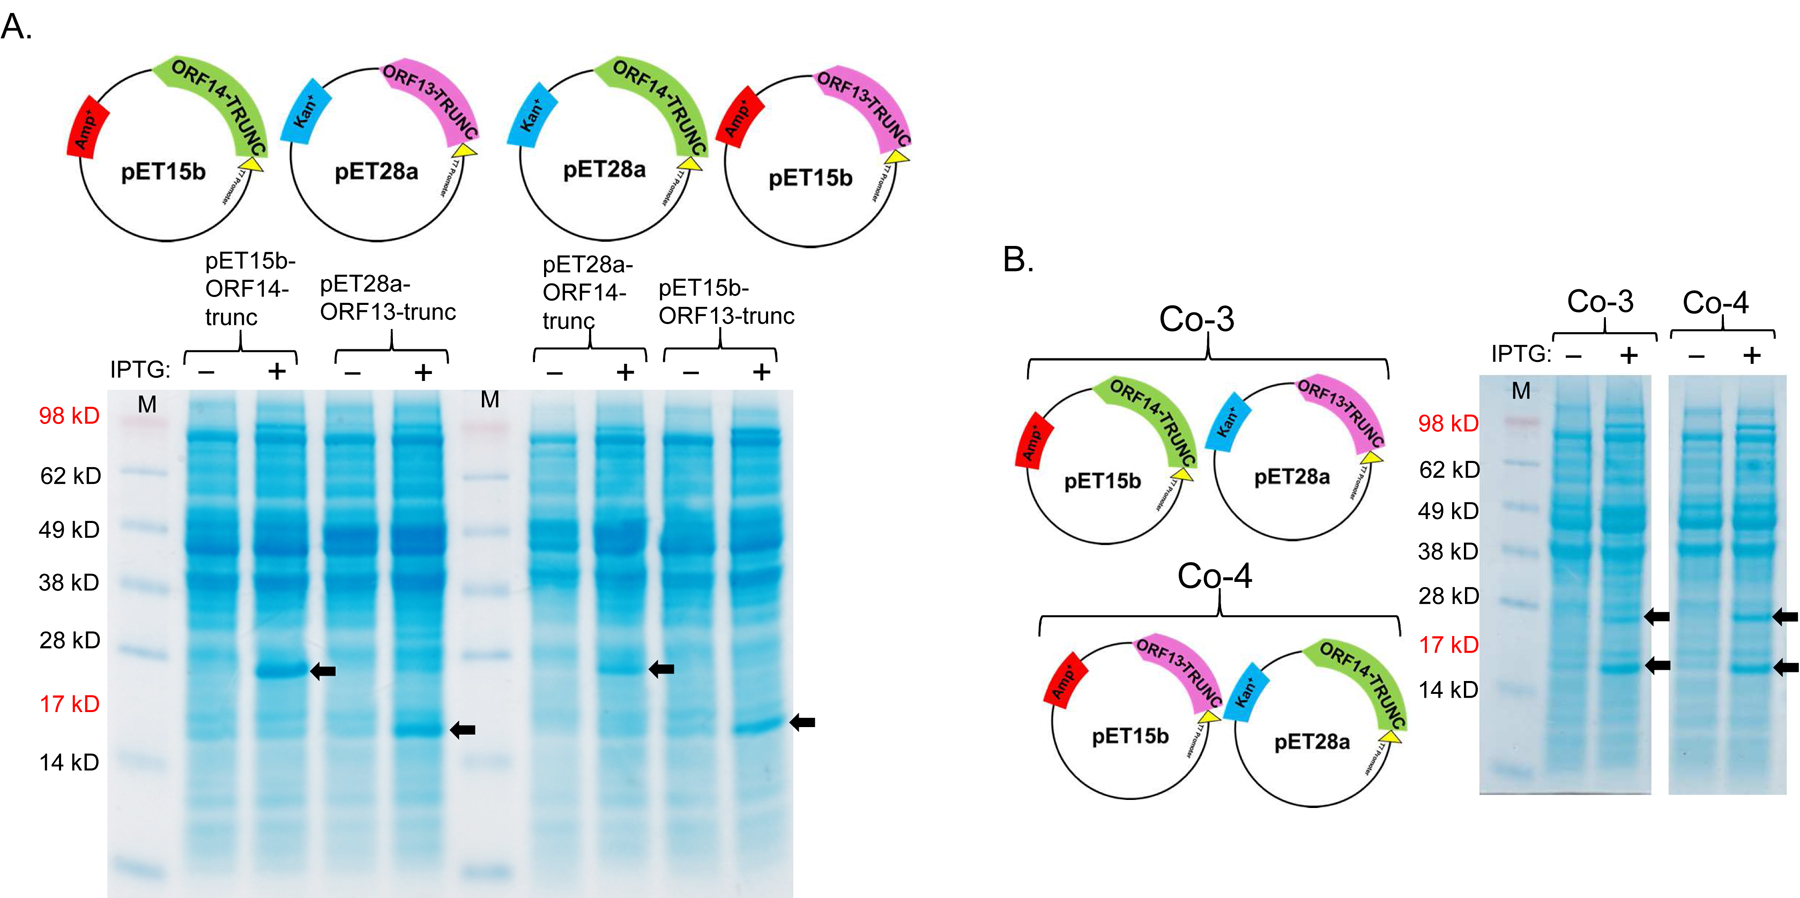
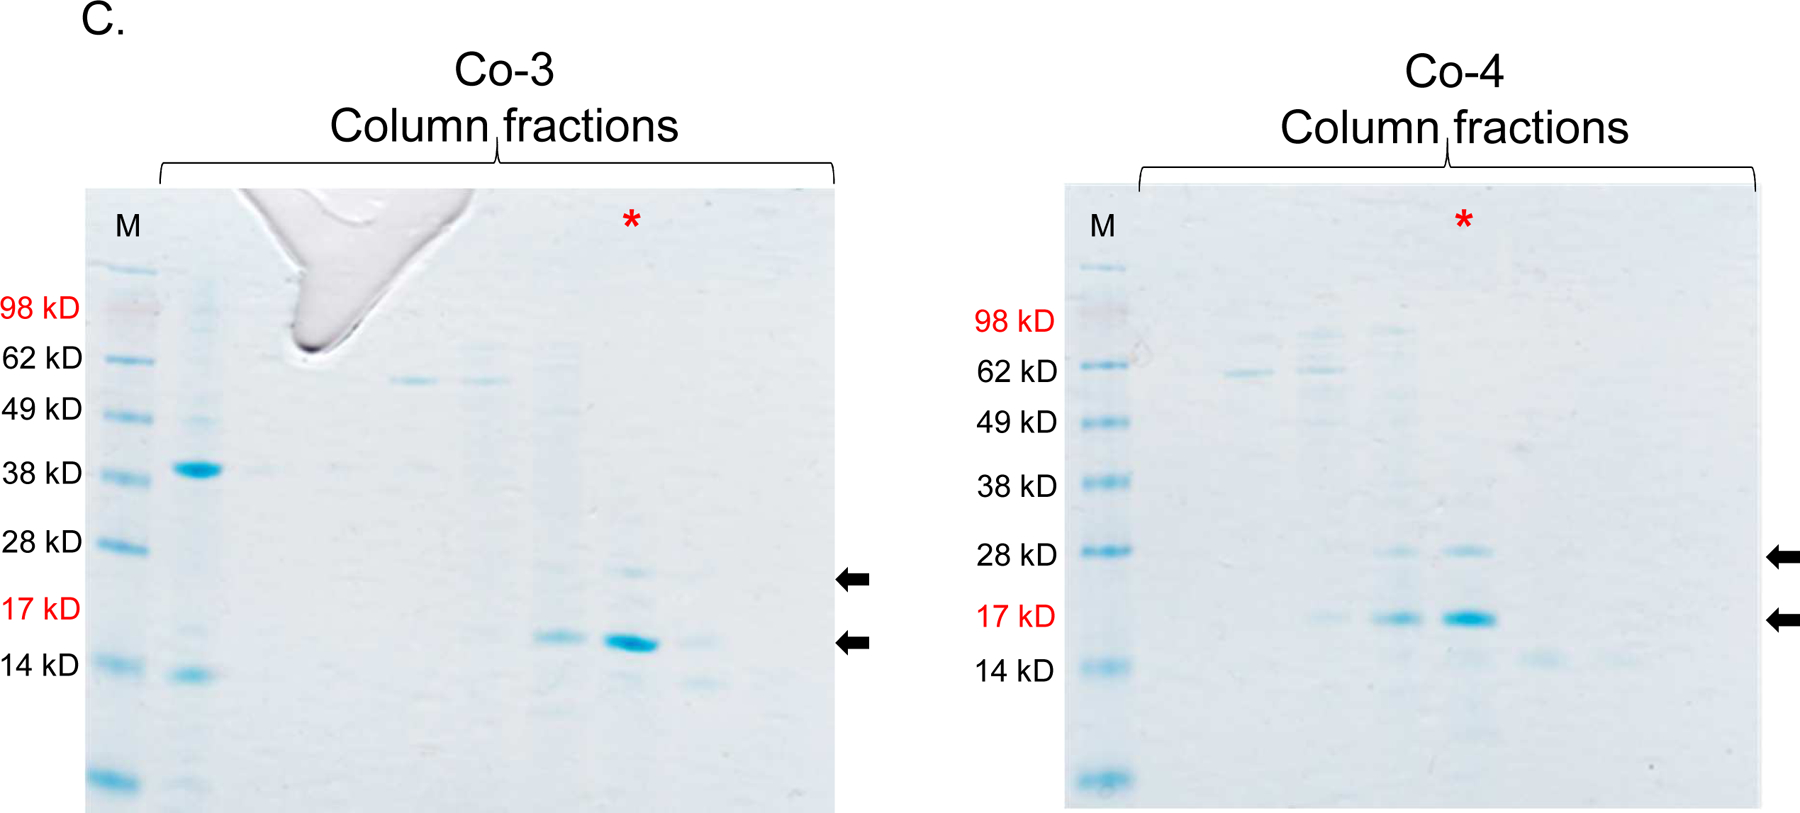
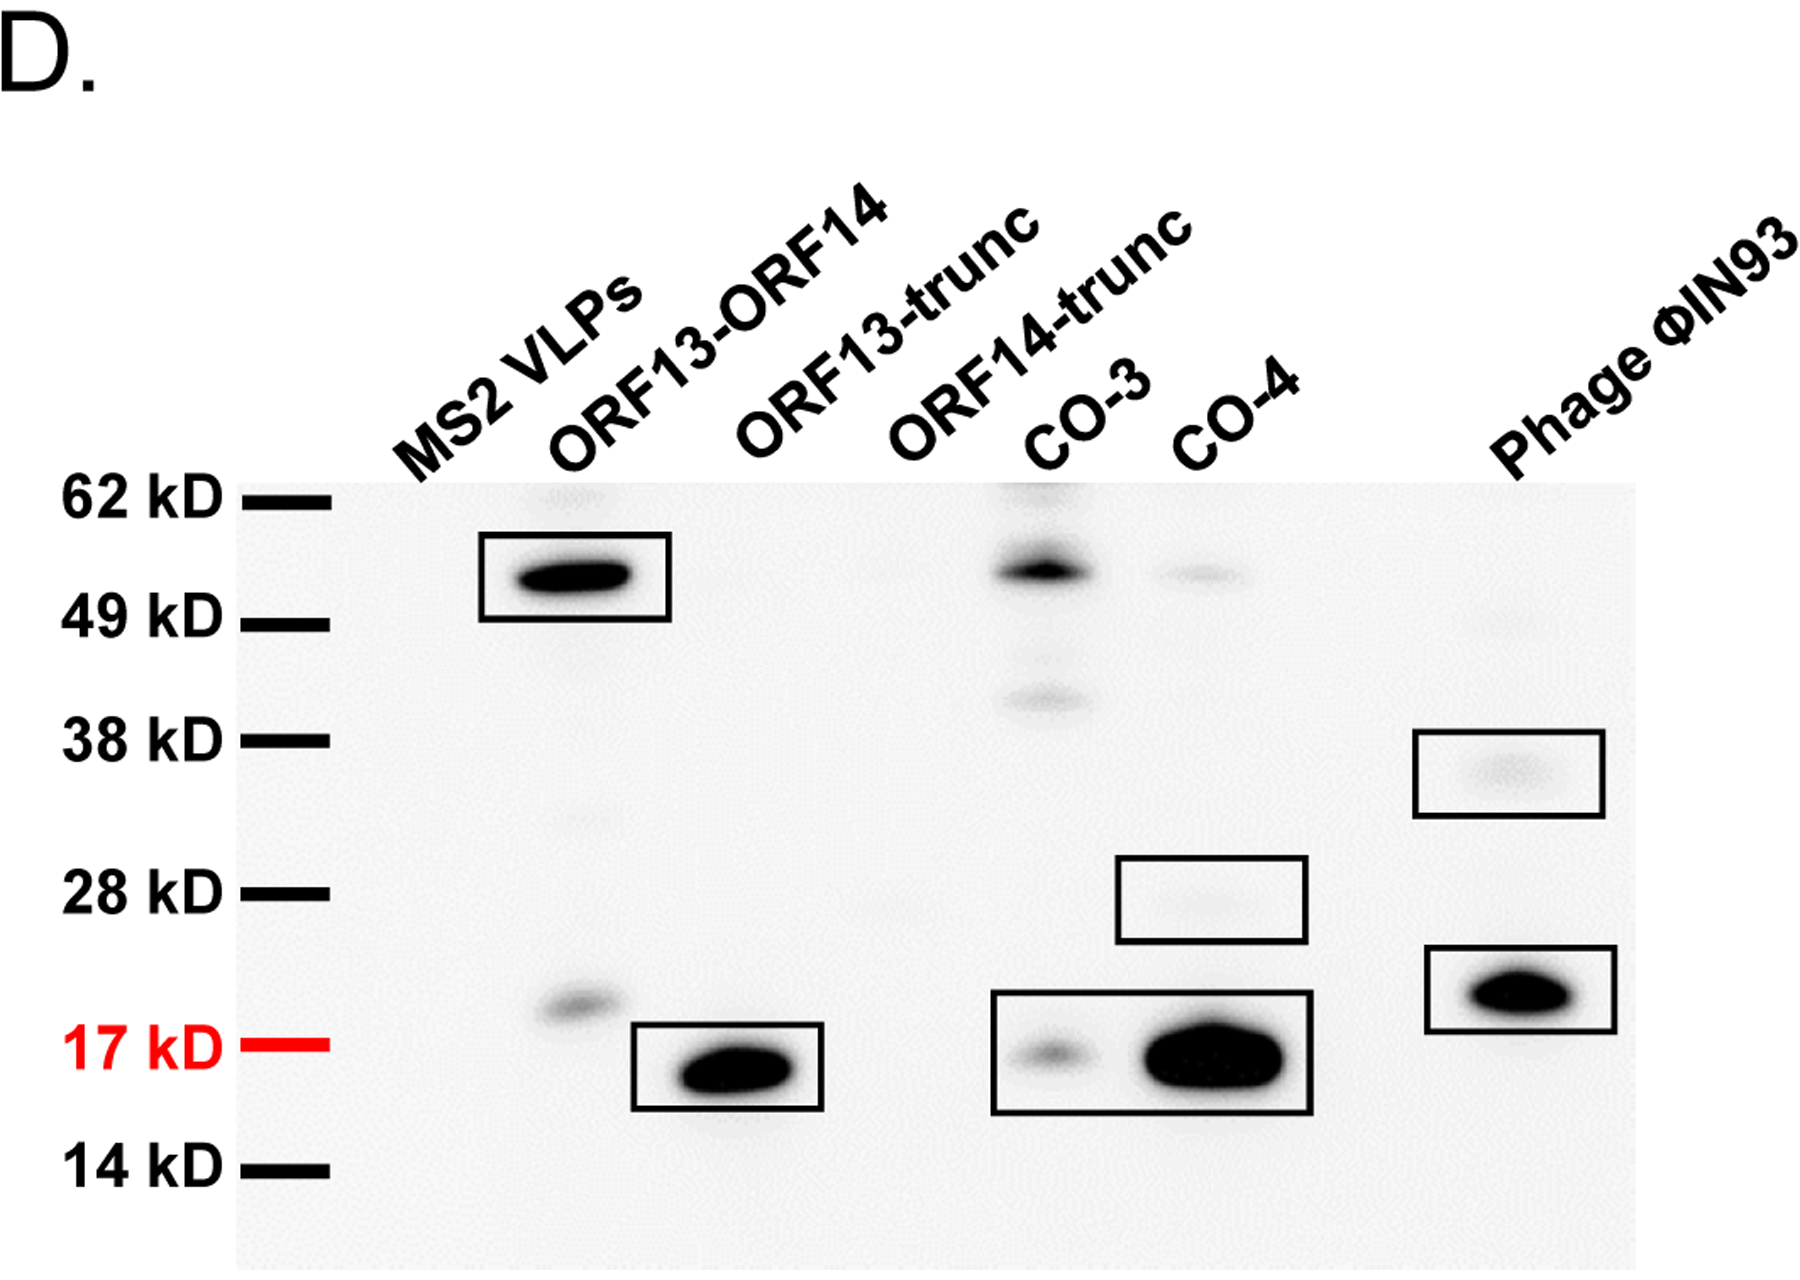
Single-expression and co-expression of truncated ORF13 (ORF13-trunc) and truncated ORF14 (ORF14-trunc) proteins in C41 cells. A) Plasmids pET15b-ORF14-trunc or pET28a-ORF13-trunc were used to separately transform C41 E. coli cells and the bacteria were grown at 37 °C. Protein expression was induced with 0.5 mM IPTG. B) Equal concentrations of plasmids pET15b-ORF14-trunc and pET28a-ORF13-trunc (Co-3) or pET15b-ORF13-trunc and pET28a-ORF14-trunc (Co-4) were mixed and used to transform C41 E. coli cells. The bacteria were grown at 37 °C and co-protein expression was induced with 1 mM IPTG. Cell pellets were lysed with 8 M Urea and loaded on SDS-PAGE gel for analysis. Gels were stained with Coomassie blue. Arrows indicate protein bands, ORF13-trunc (16.06 kD) and ORF14-trunc (24.97 kD). (−) is uninduced culture and (+) is induced IPTG culture. M=Molecular weight marker. C) Portions of column fractions of Co-3 and Co-4 were loaded to SDS-PAGE gels followed by Coomassie blue staining. Arrows indicate protein bands (ORF13-trunc and ORF14-trunc) of interest. Fractions with high purity (for example, those highlighted in red asterisk) were buffer exchanged and used for western blotting & TEM analysis. D) Western blots: ORF13-trunc, ORF14-trunc and co-expressed proteins (ORF13-trunc and ORF14-trunc) were prepared for SDS-PAGE gel and detected by serum raised from mice mentioned above. The phage MS2 VLPs were used as a negative control while the purified ORF13–ORF14 recombinant proteins and the phage ΦIN93 were used as the positive controls. Expected protein bands are highlighted in black squares.
