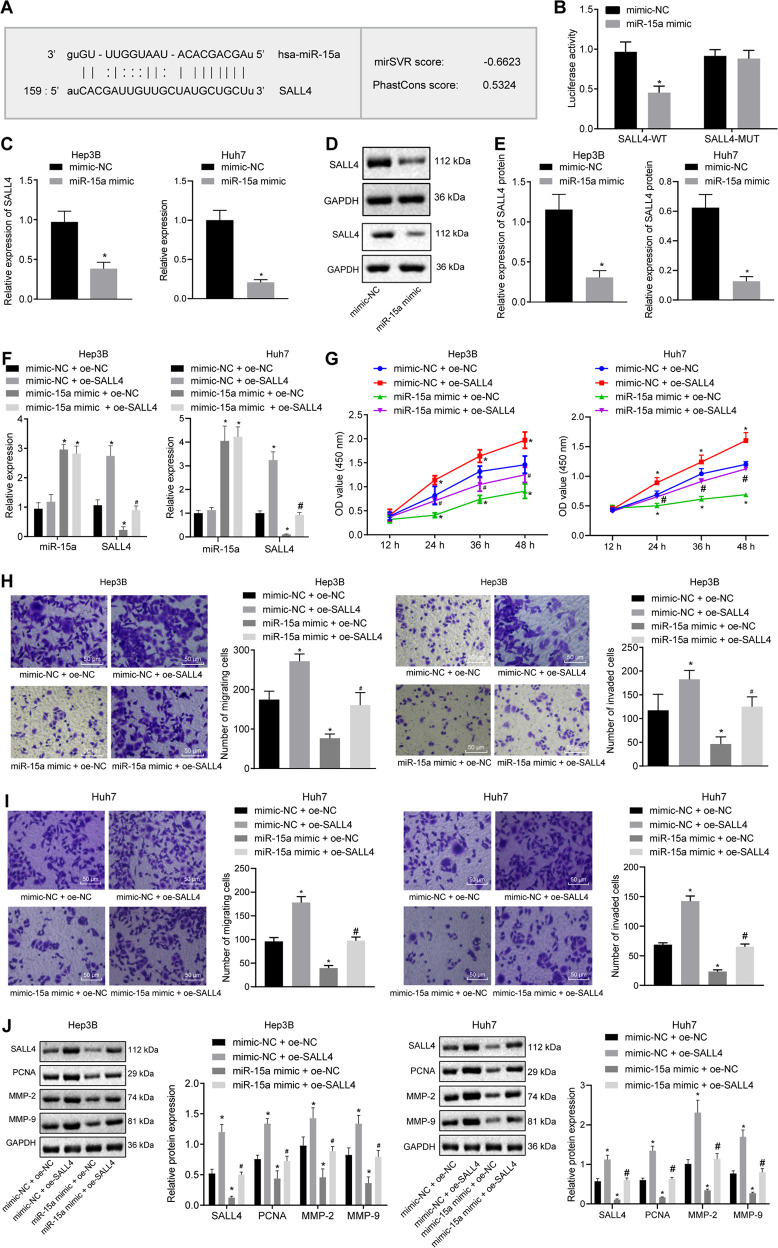
Fig. 4. miR-15a reduces proliferation, migration, and invasion of HCC cells via SALL4 inhibition in vitro.
A Putative miR-15a binding sites in the 3’UTR of SALL4 mRNA in the miRDB website (http://www.mirdb.org/). B miR-15a binding to SALL4 in cells verified by dual luciferase reporter gene assay. C mRNA expression of SALL4 was determined by RT-qPCR in miR-15a mimic-transfected Hep3B and Huh7 cells, relative to GAPDH. D Representative western blots of SALL4 protein in miR-15a mimic-transfected Hep3B and Huh7 cells, relative to GAPDH. E The quantitation of panel D. F Expression of miR-15a and SALL4 was determined by RT-qPCR in Hep3B and Huh7 cells transfected with miR-15a mimic and/or on-SALL4, relative to U6. G Proliferation of Hep3B and Huh7 cells were detected by CCK-8 following transfection with miR-15a mimic and/or oe-SALL4. H Migration of Hep3B and Huh7 cells was detected by transwell assay following transfection with miR-15a mimic and/or oe-SALL4 (×200). I Invasion of Hep3B and Huh7 cells was detected by transwell assay following transfection with miR-15a mimic and/or oe-SALL4 (×200). J Representative western blots of SALL4, MMP-2, MMP-9 and PCNA proteins in Hep3B and Huh7 cells following transfection with miR-15a mimic and/or oe-SALL4, relative to GAPDH. *p < 0.05 vs. Hep3B and Huh7 cells transfected with mimic-NC; #p < 0.05 vs. Hep3B and Huh7 cells transfected with miR-15a mimic+ of-NC. Data in panel G were analyzed by repeated-measures ANOVA with Bonferroni post hoc test. and data in panels B–E were analyzed by unpaired t-test. Data in panels F, H, I, and J were analyzed by one-way ANOVA followed by Tukey’s post hoc test. Data are shown as mean ± standard deviation of three technical replicates.

