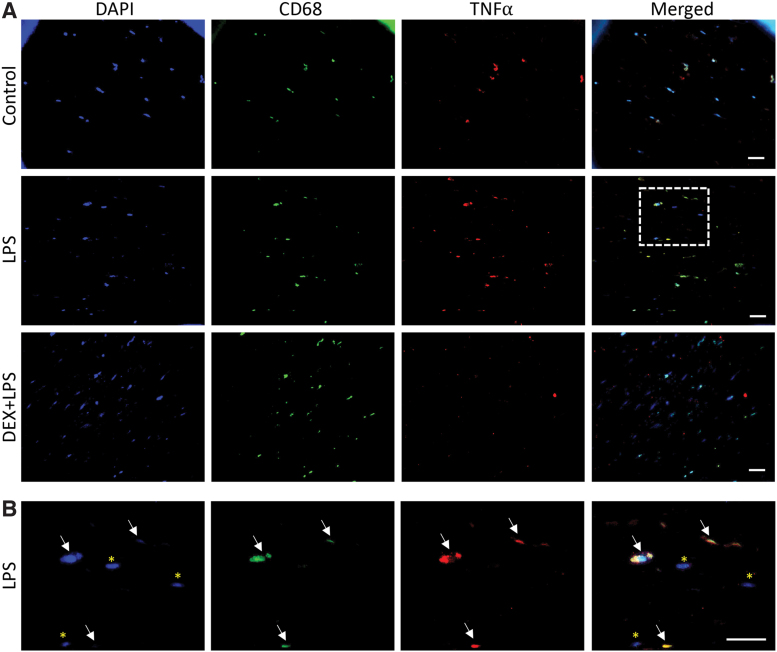
FIG. 5.
TNF-α secretion by MDM in MDM-OME. MDM-OME were challenged with LPS for 24 h following pretreatment for 4 h with or without 1 μg/mL Dex+LPS; controls received no treatment. Immunofluorescence staining of tissue sections was performed for CD68 (green), TNF-α (red), counterstained for nuclei with DAPI (blue), and images merged (A). Panel (B) shows a magnified image of the white square displayed in LPS-treated MDM-OME in (A). Scale bars = 20 μm. Color images are available online.

