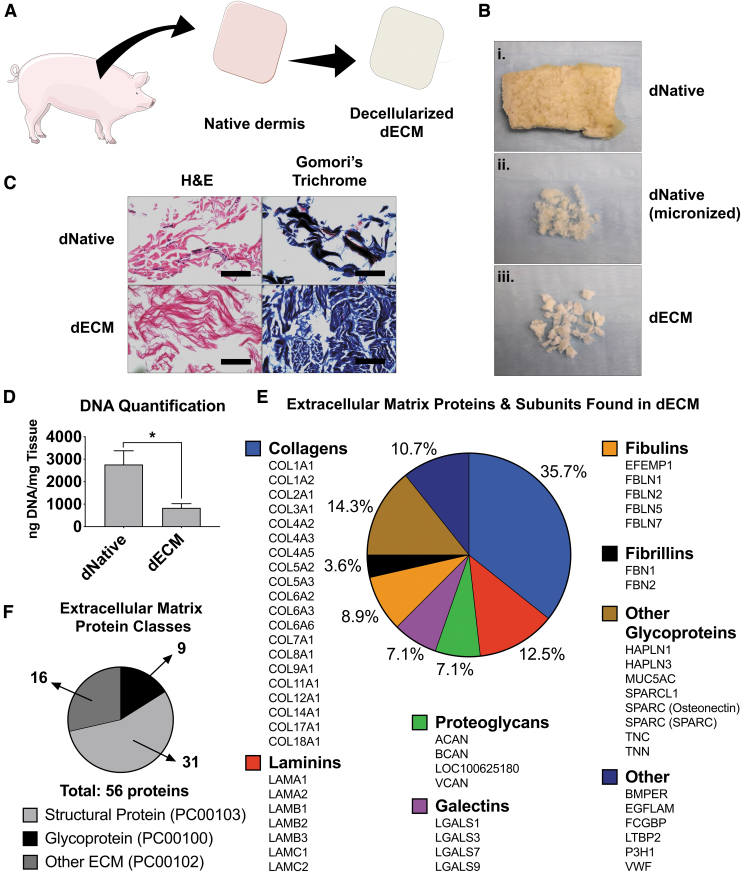
FIG. 1.
ECM derivation and characterization. (A) General schematic of the derivation of dECM. (B) Progression of decellularization. The top image is a piece of lyophilized native porcine dermis (dNative) (B.i), the center image is native porcine dermis after micronization (B.ii), and the bottom image is after decellularization and lyophilization (B.iii). (C) Histological staining (hematoxylin and eosin and Gomori's trichrome) before (dNative) and after (dECM) decellularization, showing maintenance of crucial ECM components. Scale bar = 100 μm. (D) DNA quantification using PicoGreen assay showing significant decrease of DNA content in dECM compared to dNative. *p < 0.05. (E) Breakdown of the 56 proteins found in dECM through mass spectrometry that are organized within ECM protein classes (found in the PANTHER classification system). (F) Class breakdown of the 56 proteins as sorted by their PANTHER classification. dECM, dermis extracellular matrix; dNative, native dermis; ECM, extracellular matrix. Color images are available online.

