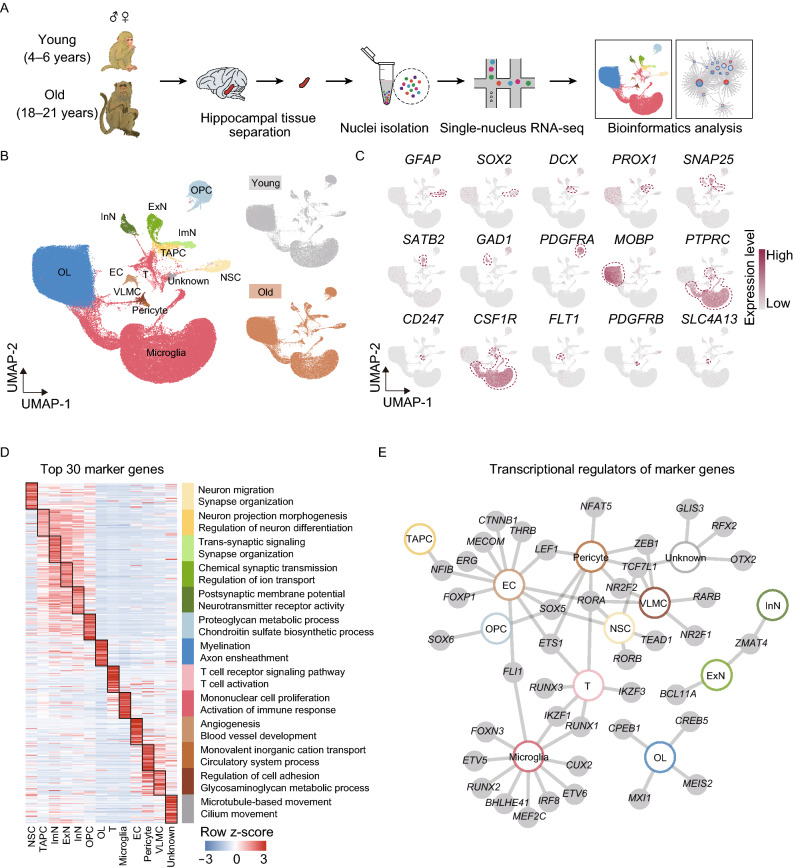
Figure 3.
Construction of single-nucleus transcriptomic atlas of the monkey hippocampus. (A) Flow chart of snRNA-seq and bioinformatics analysis of the monkey hippocampus. Young, n = 7; old, n = 8 monkeys. (B) Left, UMAP plot showing distribution of different cell types in the monkey hippocampus. Right, UMAP plots showing distribution of different cell types in the young (top) and old (bottom) hippocampus. (C) UMAP plots showing the expression profiles of indicated cell-type-specific marker genes of corresponding cell types in the monkey hippocampus. (D) Heatmap showing the expression profiles of top 30 cell-type-specific marker genes of different cell types in the monkey hippocampus with their enriched functional annotations on the right. (E) Network plot showing transcriptional regulators of cell-type-specific marker genes (adjusted P-value < 0.05, |logFC| > 1) of different cell types in the monkey hippocampus

