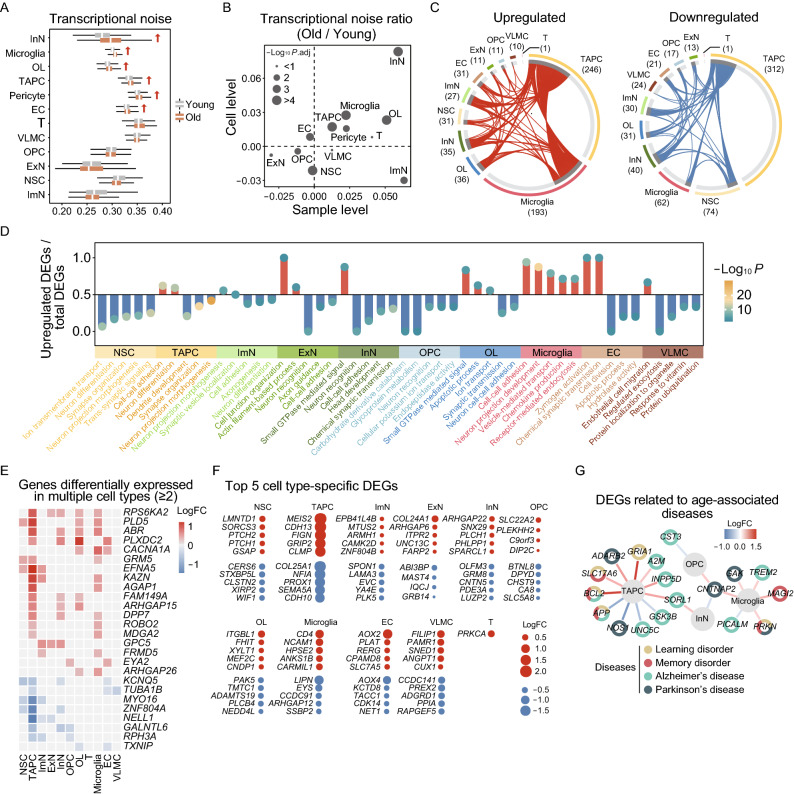
Figure 4.
Cellular and molecular aging characteristics of the aged monkey hippocampus. (A) Boxplot showing transcriptional noise in different cell types in young and old monkey hippocampus. Arrows indicate cell types whose transcriptional noise is significantly increased in the aged groups. (B) Scatter plot showing the log2 ratio of transcriptional noise of different cell types in the monkey hippocampus between the old and young groups at the cell and sample levels. (C) Circos plots showing aging-related up- and down-regulated differentially expressed genes (DEGs) (adjusted P-value < 0.05, |logFC| > 0.25) of different cell types in the monkey hippocampus. Each connecting curve represents a gene that is up- or down-regulated in two cell types. (D) Bar plot showing GO terms enriched for aging-related DEGs of different cell types in the monkey hippocampus. Y axis represents the ratio of upregulated genes to total DEGs in corresponding terms. (E) Heatmap showing genes differentially expressed in at least two cell types in the monkey hippocampus. Only genes with same direction of differential expression among different cell types are included. (F) Dot plots showing top five cell-type-specific DEGs of different cell types. Only those with annotations are showed. Red dots represent upregulated genes and blue dots represent downregulated ones. (G) Network plot showing DEGs associated with aging-related diseases in different cell types in the monkey hippocampus

