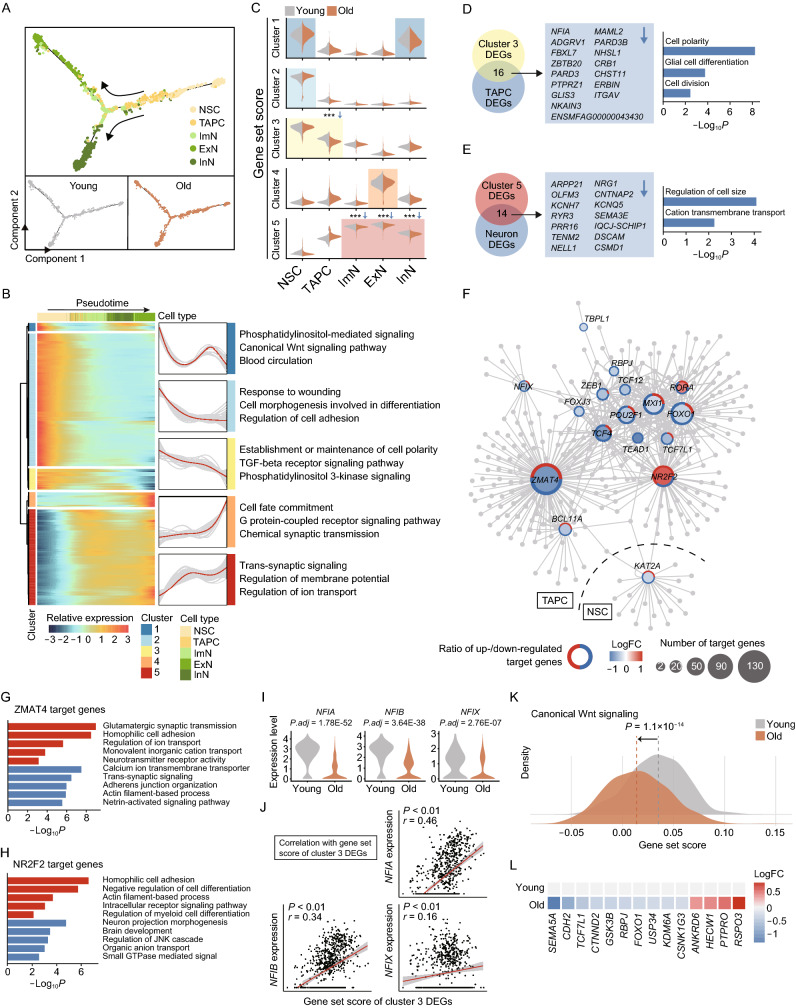
Figure 5.
Aging-related cellular and molecular alterations along the trajectories of the neurogenesis. (A) Pseudotime analysis of the neurogenic lineage cells in the monkey hippocampus. The points are colored by cell types (top) and age (bottom). The arrows indicate the directions of differentiation trajectories. (B) Heatmap showing the expression profiles along the pseudotime of top 500 DEGs (q value < 1 × 10⁻⁴), which were divided into five clusters with the expression pattern and enriched GO terms of the corresponding cluster represented on the right. (C) Violin plots showing gene set scores of indicated clusters in different stages of neurogenic cells of young and old groups. ***P < 0.01. (D) Left, pie plot showing overlapped genes between cluster 3 DEGs and aging-related downregulated DEGs of TAPC in the monkey hippocampus. Right, bar plot showing enriched GO terms of the overlapped genes listed on the left. (E) Left, pie plot showing overlapped genes between cluster 5 DEGs and aging-related downregulated DEGs of neurons in the monkey hippocampus. Right, bar plot showing enriched GO terms of the overlapped genes listed on the left. (F) Network plot showing transcriptional regulators of aging-related DEGs in NSC and TAPC in the monkey hippocampus. Node size indicates the number of target genes. Outer circle of the node indicates the proportion of up regulated (red) and down regulated (blue) target genes regulated by corresponding transcriptional regulators. (G) Bar plot showing GO terms of target genes of ZMAT4. Red, upregulation; blue, downregulation. (H) Bar plot showing GO terms of target genes of NR2F2. Red, upregulation; blue, downregulation. (I) Violin plots showing expression levels of NFIA, NFIB and NFIX in TAPC in the monkey hippocampus from young and old groups. (J) Spearman’s correlations between gene set score of cluster 3 DEGs and the expression levels of NFIA, NFIB and NFIX in TAPC of the monkey hippocampus. (K) Density plot showing gene set scores of genes related to canonical Wnt signaling pathway in TAPC of the monkey hippocampus from young and old groups. (L) Heatmap showing the expression changes of aging-related DEGs associated with canonical Wnt signaling in TAPC of the monkey hippocampus from young and old groups.

