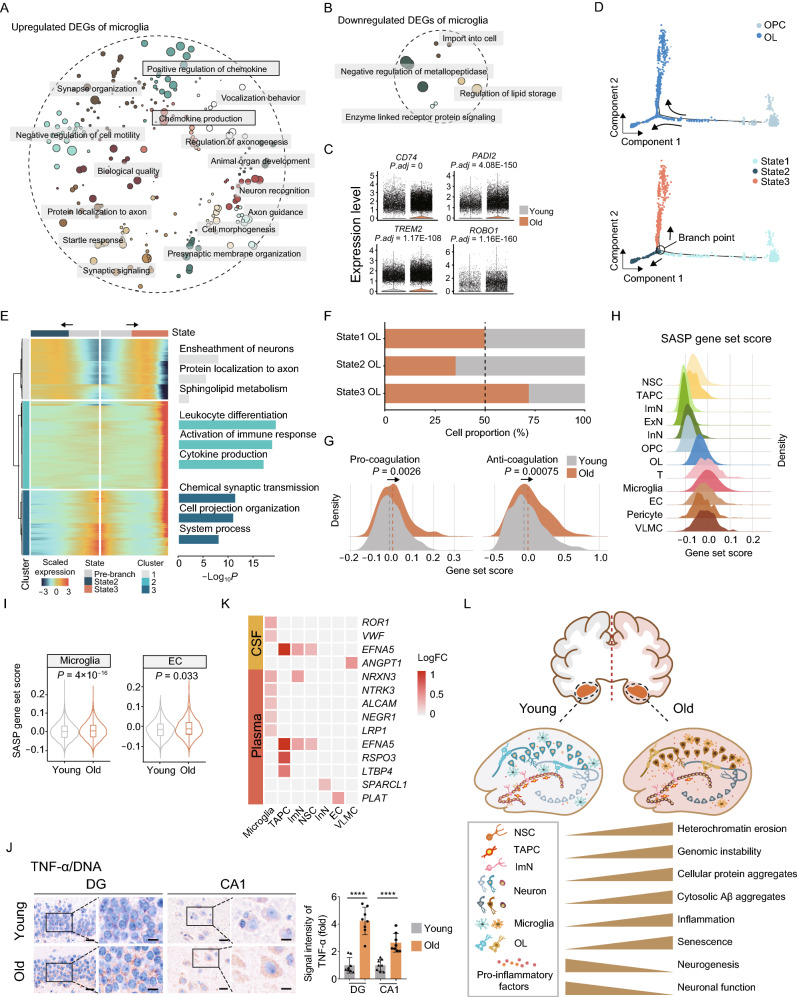
Figure 6.
Elevated inflammation with age in the monkey hippocampus. (A) Dot plot showing GO terms of aging-related upregulated DEGs in microglia of the monkey hippocampus. Each dot indicates a GO term and similar entries were clustered together. (B) Dot plot showing GO terms of aging-related downregulated DEGs in microglia of the monkey hippocampus. Each dot indicates a GO term and similar entries were clustered together. (C) Violin plots showing expression levels of indicated genes in microglia of the monkey hippocampus from young and old. (D) Pseudotime analysis of OPC and OL in the monkey hippocampus. Cells are colored by the cell types (top) and the states (below). The arrows indicate the directions of differentiation trajectories. (E) Heatmap showing the expression profiles along the pseudotime of top 500 DEGs (q value < 1 × 10⁻⁴) in OL and OPC, which were then divided into three clusters with the expression pattern and enriched GO terms of the corresponding cluster represented on the right. (F) Bar plot showing the proportions of different states of OL in the hippocampus from young and old groups. (G) Density plot showing gene set scores of pro-coagulation and anti-coagulation genes in EC of the monkey hippocampus from young and old groups. (H) Density plot showing gene set scores of senescence-associated secretory phenotype (SASP) genes in different cell types in the monkey hippocampus. (I) Violin plots showing increasing SASP gene set scores in microglia and EC in the monkey hippocampus from young and old groups. (J) Immunohistochemical staining of TNF-α (brown) and counterstaining of cell nuclei by hematoxylin solution (blue) in the hippocampus from young and old monkeys. Representative images are shown on the left; signal intensity of TNF-α is quantified as fold changes in the old DG and CA1 regions vs. in young counterparts, shown as means ± SEM on the right. Scale bars, 20 μm and 10 μm (zoomed-in images). Young, n = 8; old, n = 8 monkeys. ****P < 0.0001. (K) Heatmap showing aging-related DEGs and their age-associated protein products in human cerebrospinal fluid (CSF) and plasma in different cell types in the monkey hippocampus. (L) A schematic illustration showing the phenotypic and transcriptomic signatures of NHP hippocampal aging.

