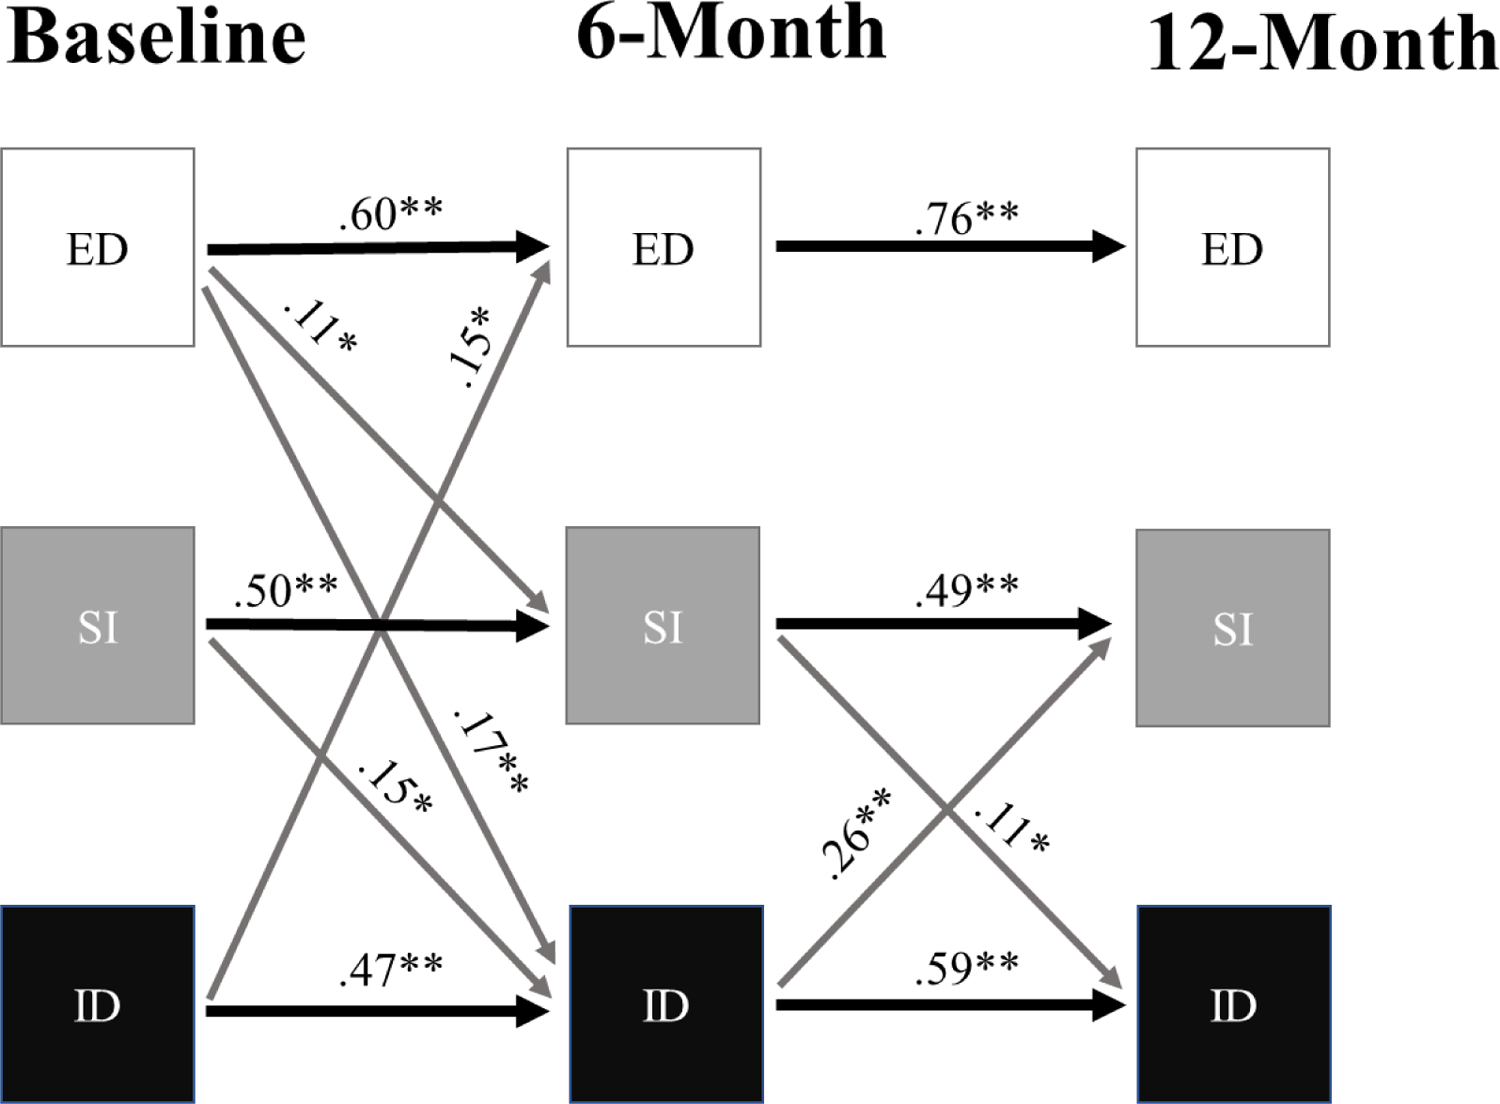
Figure 1. Significant standardized path coefficients for autoregressive cross-lag model tested.

Note. * p<.05; ** p < .01; black lines = significant autoregressive paths; gray lines = significant cross-lagged paths; ED = Eating disorder symptoms SI = suicidal ideation; ID = Interoceptive deficits; although not illustrated for ease of interpretation, variables were permitted to covary at each time point.
