
Figure 2. Causal association from the 2‐step least squares (2SLS) Mendelian randomization between the genetic risk scores (GRSs) and blood pressure traits in the MDC (Malmö Diet and Cancer) cohort.
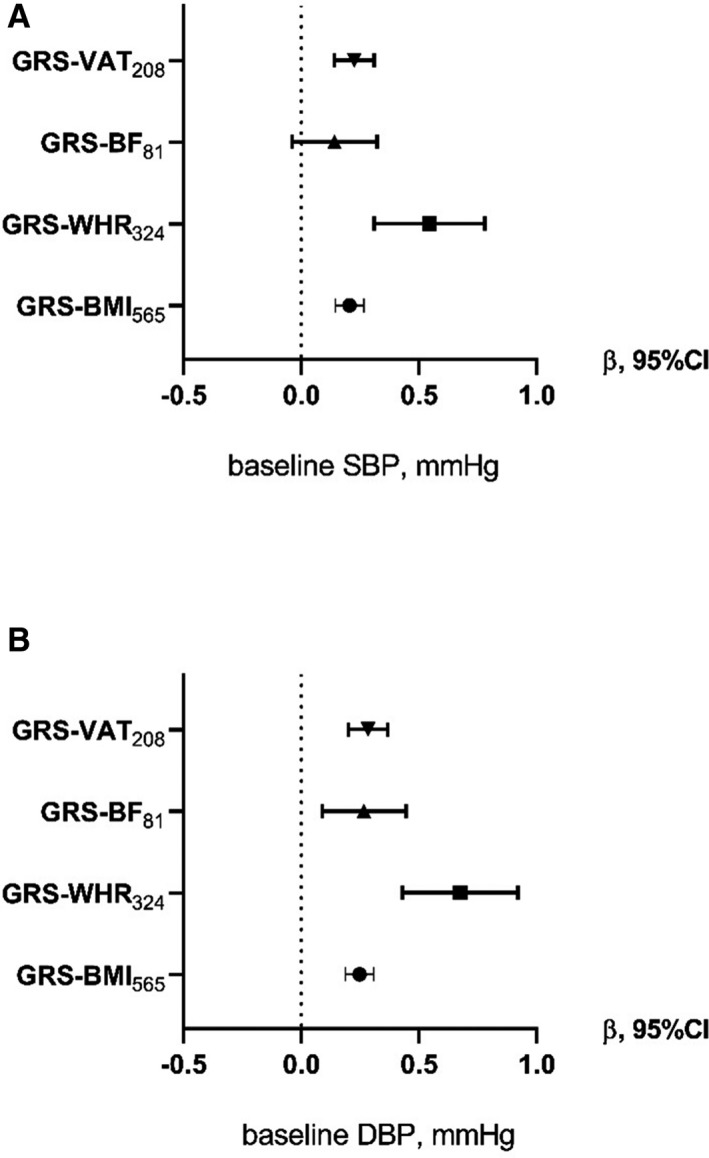
Each forest plot shows the causal estimates (β) from the 2SLS regression of the 4 GRSs with blood pressure outcomes SBP (A) or DBP (B) in the MDC cohort for Model 2 (adjustment for age, sex, age2, age×sex). An increase of 1 SD in GRS‐VAT208 is associated with an SD increase of 0.326 of SBP. DBP indicates diastolic blood pressure; GRS‐BF81, GRS for body fat associated with 81 SNPs; GRS‐BMI565, GRS for body mass index associated with 565 SNPs; GRS‐VAT208, GRS for visceral adipose tissue associated with 208 SNPs; GRS‐WHR324, GRS for waist‐to‐hip ratio associated with 324 SNPs; SBP, systolic blood pressure; and SNPs, single nucleotide polymorphisms.