
Figure 3. AhR activation by ITE drives macrophage polarization in the infarcted myocardium.
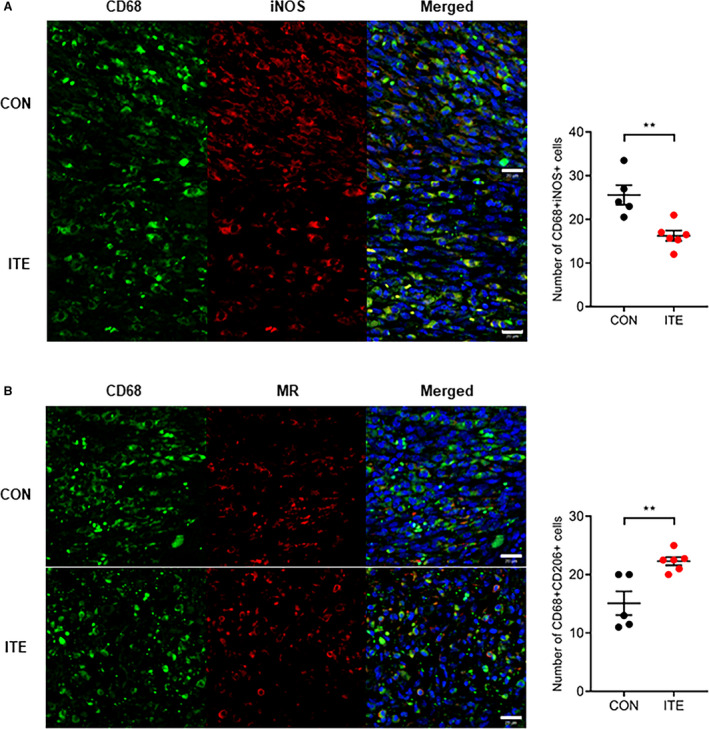
A, Representative confocal IF images of M1 macrophages in infarcted hearts at 5 days after MI. Sections were stained for CD68 (green) and iNOS (red) (left). The number of CD68+iNOS+ cells in control and ITE‐injected mice was counted (right). B, Representative confocal IF images of M2 macrophages in infarcted hearts at 5 days after MI. Cells were stained for CD68 (green) and MR (red) (left). The number of CD68+MR+ cells in control and ITE‐injected mice was counted (right) (n=5: control, n=6: ITE). Scale bars=20 µm. Data are presented as mean±SEM and were analyzed using an unpaired t test. AhR indicates aryl hydrocarbon receptor; CON, control; IF, immunofluorescence; iNOS, inducible nitric oxide synthase; ITE, 2‐(1’H‐indole‐3’‐carbonyl)‐thiazole‐4‐carboxylic acid methyl ester; MI, myocardial infarction; and MR, mannose receptor. **P<0.01.