
Figure 4. ITE regulates the production of anti‐inflammatory and proinflammatory cytokines.
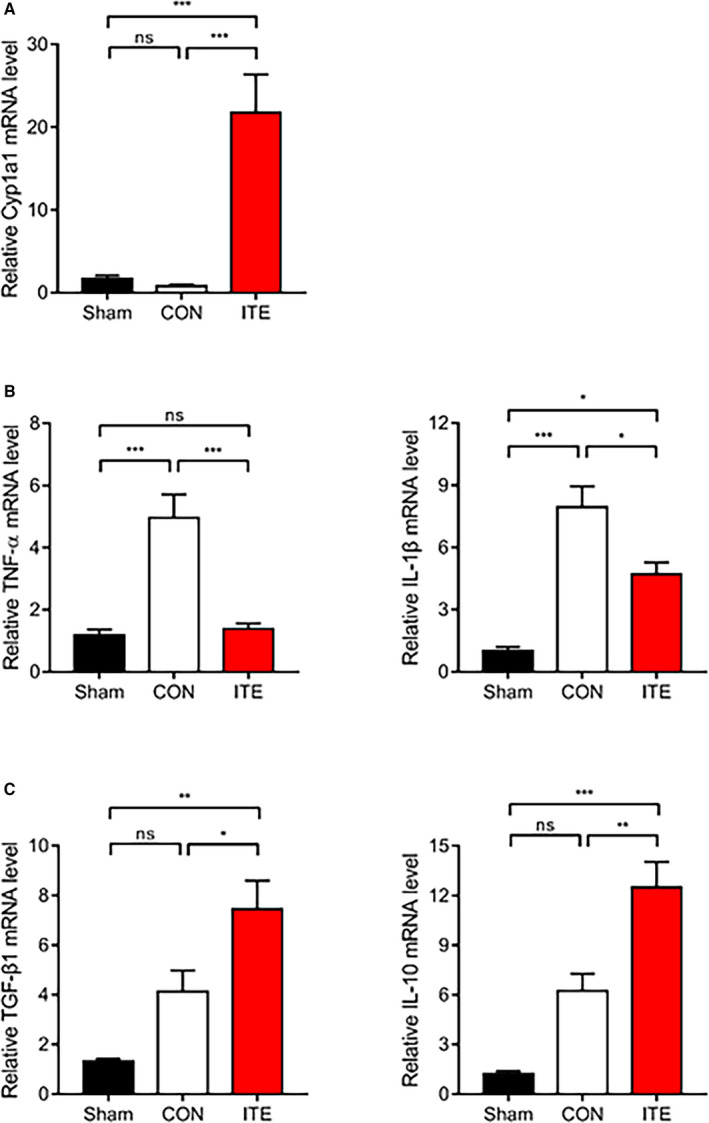
A, Relative mRNA expression of Cyp1a1 in infarcted tissues determined by quantitative real‐time polymerase chain reaction. Expression of mRNA transcripts encoding the proinflammatory cytokines TNF‐α and IL‐1β (B) and the anti‐inflammatory cytokines TGF‐β1 and IL‐10 (C) in infarcted tissues at 5 days after MI (n=5‒7 per group). The values are normalized to GAPDH and expressed as the fold‐change from sham values. The results were compared using 1‐way ANOVA. Data are presented as mean±SEM. CON indicates control; Cyp1a1, cytochrome P450 1A1; IL, interleukin; ITE, 2‐(1’H‐indole‐3’‐carbonyl)‐thiazole‐4‐carboxylic acid methyl ester; MI, myocardial infarction; ns, not significant; TGF‐β1, transforming growth factor beta 1; and TNF‐α, tumor necrosis factor alpha. *P<0.05. **P<0.01. ***P<0.001.