
Figure 3. Conventional‐FFR and diastolic‐FFR changes during both adenosine and dobutamine provocation in relations to stress‐echocardiography (SE) results.
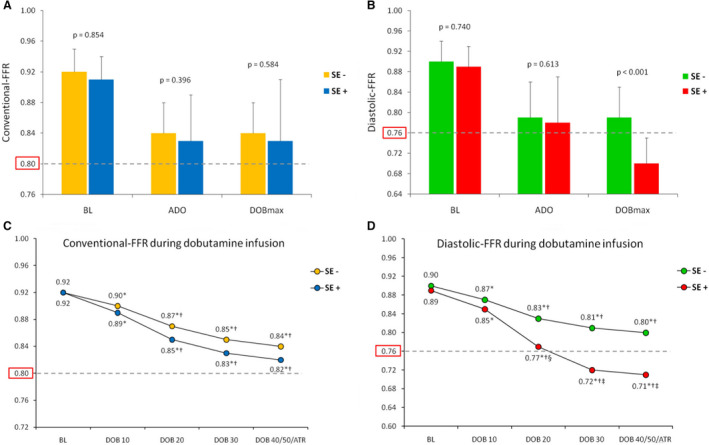
A, Conventional‐FFR, and (B) diastolic‐FFR during both adenosine (ADO) and peak dobutamine infusion (DOBmax) in relation to SE results. C, Conventional‐FFR and (D) diastolic‐FFR during dobutamine infusion (10–50 µg/kg/min) in relation to SE results. Dotted lines in all figures represent the ischemic tresholds for conventional‐FFR (0.80) and diastolic‐FFR (0.76). BL indicates basal conditions, before dobutamine infusion; DOB, dobutamine; DOB 10, 10 µg/kg/min of DOB; DOB 20, 20 µg/kg/min of DOB; DOB 30, 30 µg/kg/min of DOB; DOB 40/50/ATR, 40 or 50 µg/kg/min of DOB, or atropine; FFR, fractional flow reserve; SE−, group of patients without stress‐induced ischemia; and SE+, group of patients with stress‐induced ischemia. *P<0.05 vs BL; † P<0.05 vs preceding value; ‡ P<0.05 vs SE− group.