
Figure 3. Subgroup analysis based on chronic kidney disease.
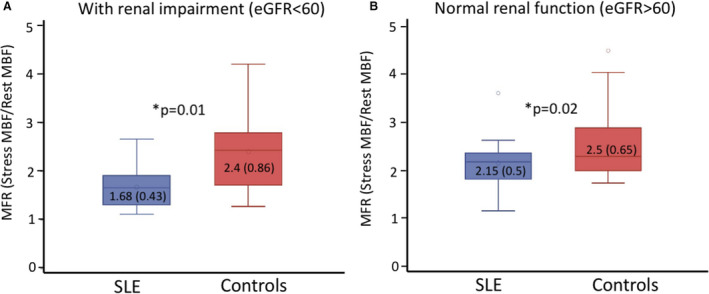
Subjects were only included in the analysis if a serum creatinine was performed within 90 days of cardiac positron emission tomography (40/42 systemic lupus erythematosus [SLE] and 52/69 control group). A, Box and whisker plot of the distribution of myocardial flow reserve (MFR) in SLE and controls with renal impairment (estimated glomerular filtration rate [eGFR] <60). B, Distribution in patients with normal renal function. Mean and SD are shown within box plots. MBF indicates myocardial blood flow.