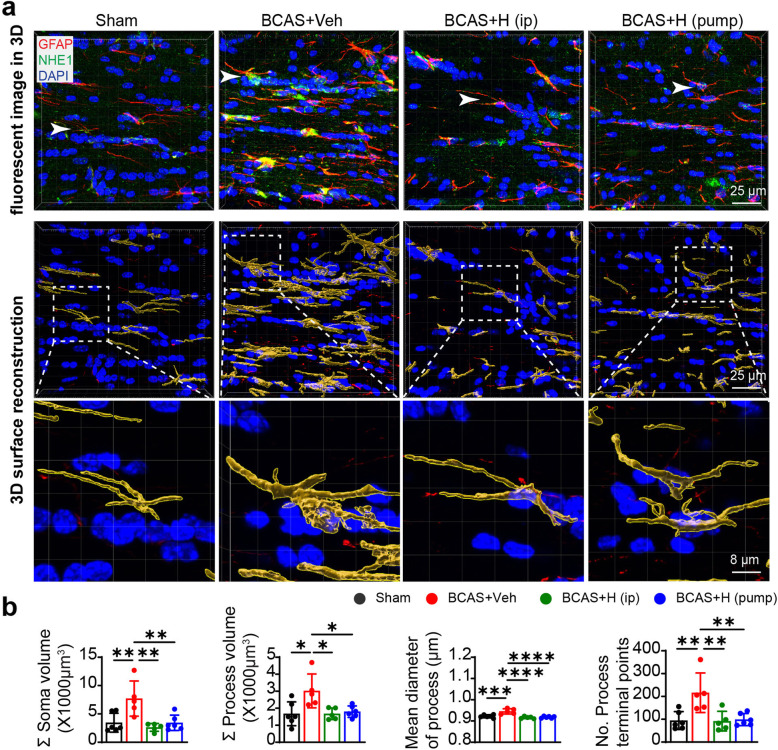
Fig. 4.
Inhibition of NHE1 by HOE642 suppressed BCAS-induced hypertrophy of reactive astrocytes in white matter tracts. a Representative IMARIS 3D view of raw immunofluorescent Z-stack images: GFAP (red), NHE1 (green) and DAPI (blue), and 3D surface reconstruction of astrocytes based on GFAP immunostaining (red) in CC. White arrow: the position of boxed astrocytes in surface reconstruction in immunofluorescent Z-stack images. b Quantitative analysis of sum of soma volume, process volume, process mean diameter and terminal points of process for sham, BCAS+Veh, BCAS+HOE (i.p.) and BCAS+HOE (pump) groups. Data are presented as mean ± SD. n = 5–6/group. *p < 0.05, **p < 0.01, ***p < 0.001, ****p < 0.0001

