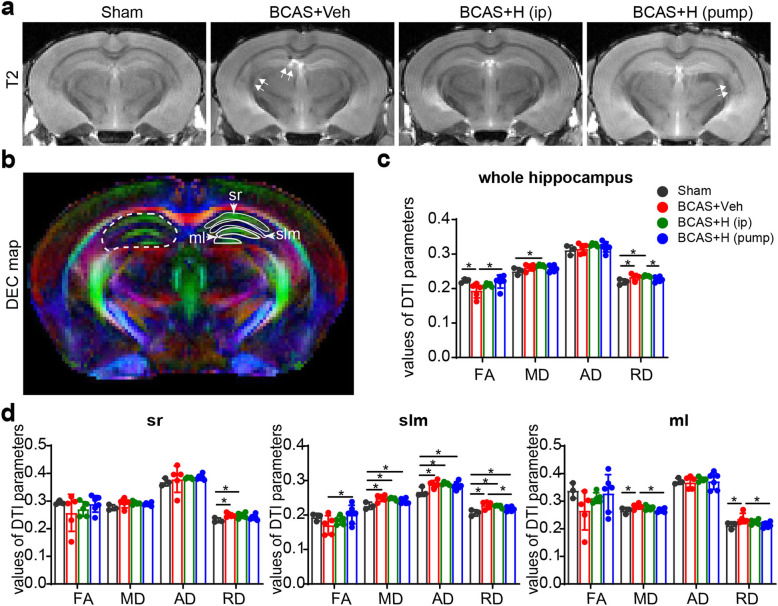
Fig. 5.
MRI revealed tolerance of HOE642-treated mice to BCAS-induced hippocampal injury. a Representative T2-weighted images of ex vivo brains of sham, BCAS+Veh, BCAS+HOE (i.p. or pump) mice at 30 days post-surgery. Double white arrow indicates damage on T2-weighted images. b Representative DEC maps of ex vivo brain showing ROIs in whole hippocampus (white dash line), stratum radiatum (sr), stratum lacunosum-meloculare (slm), and molecular layer (ml). c Quantitative analysis of FA, MD, AD, RD values of whole hippocampus. d Quantitative analysis of FA, MD, AD and RD values of different hippocampal regions. Data are presented as mean ± SD. n = 3–6/group. *p < 0.05

