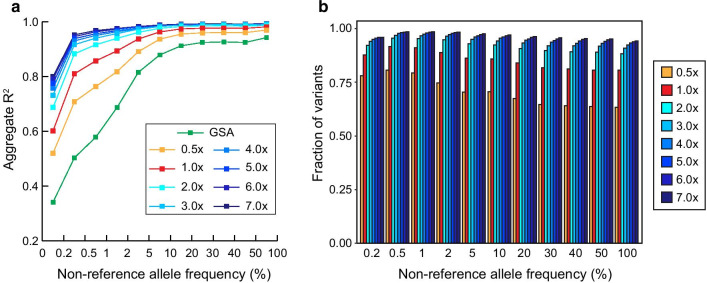
Fig. 2.
Imputation accuracy comparison across allele frequency bins. a Imputation accuracy of simulated GSA and downsampled LPS constructed by 8 WGS at each frequency bin. Two different approaches; GLIMPSE and Minimac4 were used for imputing downsampled LPS and simulated GSA, respectively. The x-axis represents non-reference allele frequency (AF) of East Asian population derived from the gnomAD v3.1. Variants were defined to be rare, low and common when AF < 0.5%, 0.5% ≤ AF < 5% and AF ≥ 5%, respectively. The y-axis represents aggregate R2 of variants between high-coverage genotypes and imputed dosages at each frequency bin. b Direct comparison of imputation accuracy using overlapping imputed SNPs with R2 > 0.8 between GSA and downsampled LPS. The x-axis represents non-reference allele frequency (AF) of East Asian population derived from the gnomAD v3.1. The y-axis represents the fraction of SNPs that were more accurately imputed SNPs in downsampled LPS

