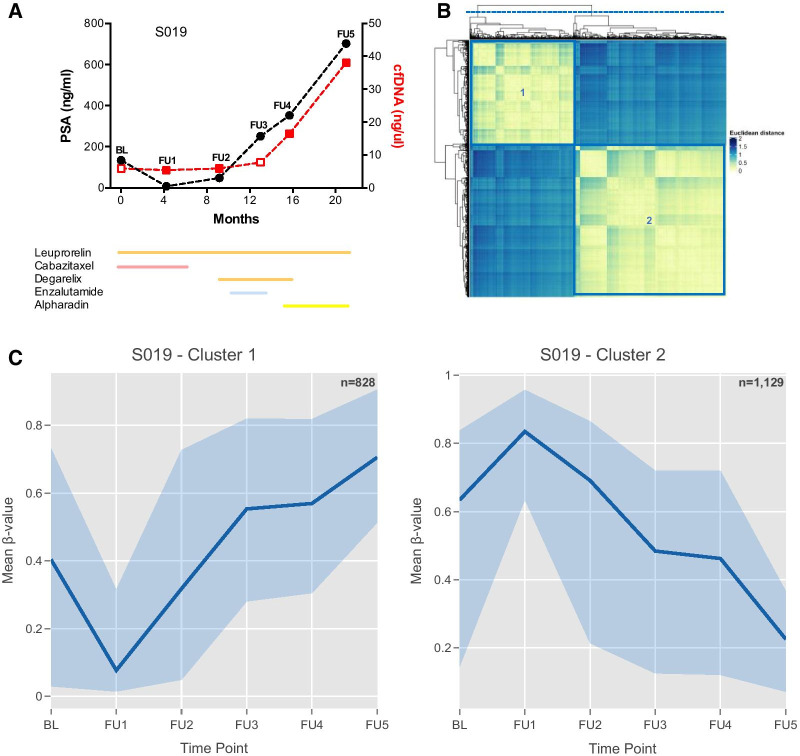
Fig. 2.
Longitudinal analysis of metastatic PCa patient S019 highlights dynamic methylation patterns across time and their association with clinical findings. A Disease course (since recruitment to iPROSPECT study—baseline). PSA levels (ng/mL) and cfDNA concentration (ng/µL) are represented in the left (black) and right (red) y axis, respectively. Details of therapies administered are indicated by coloured lines below the graph: LHRH agonists/antagonist (orange), taxane (pink), AR inhibitors (blue) and radioisotopes (yellow). B Heatmap showing the similarity of patterns between probes, located in 5′ regulatory regions (n = 9549), across time. Probes with similar methylation patterns were aggregated into clusters, which are identified in the heatmap by purple boxes and numbers. Unsupervised clustering was performed using euclidean distances between probes and coloured legend reflects magnitude of those distances (blue to yellow–small to large distance). C Methylation dynamics observed for genes identified through cluster analysis, with total number of genes used indicated in the top right corner for each cluster. Only genes represented by ≥ 2 dynamic CpGs are shown. Blue filled area represents methylation values observed at each time point, with edges indicating the maximum and minimum values observed. Darker blue line represents the observed mean methylation value of all genes. Black lines, on the upper part of the plots, indicate the duration of administration of a specific PCa therapies, whose effect was explored in our study (taxanes—T; AR inhibitors—AR). BL baseline, cfDNA cell-free DNA, FU follow-up, PSA prostate specific antigen

