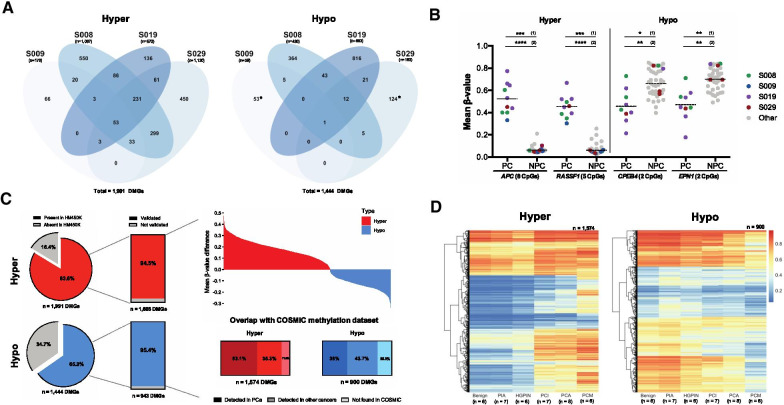
Fig. 4.
Identification of differentially methylated genes in cfDNA samples with prostate content and validation of results across independent cohorts. A Numbers of significantly hyper and hypomethylated differential methylated genes (DMGs) identified by comparing samples with prostate cell content (PC) versus samples without (NPC), across the 4 subjects with samples having substantial prostate content (≥ 10%). B Schematic representation of 4 DMGs. Circles represent individual mean β-values. The 4 subjects with PC samples are distinguished from the 5 remaining subjects (grey). Statistical analysis identified differences between (1) PC and NPC samples within subjects with prostate content and (2) PC samples from subjects with prostate content and all NPC samples. C Validation of DMGs in an independent cfDNA cohort (n = 181). Waterfall plot indicates the degree of methylation difference between NPC (considered baseline in this plot) and PC samples for validated DMGs. Additionally, overlap of DMGs and the COSMIC methylation dataset indicated genes whose methylation had previously been detected in PCa and/or other cancers. D Heatmap showing methylation status of validated DMGs in an independent PCa tissue cohort, comprising all histological stages of PCa development. Differences between PC and NPC samples in B and C were carried out using an independent t test/Mann–Whitney U test, and multiple testing correction (Benjamini–Hochberg method) was used when appropriate. p values are as follow: *p ≤ 0.05; **p ≤ 0.01; ***p ≤ 0.001; ****p ≤ 0.0001. PC prostate content, NPC no prostate content, PIA proliferative inflammatory atrophy, HGPIN high-grade prostatic intraepithelial neoplasia, PCI prostate cancer (indolent), PCA prostate cancer (aggressive), PCM prostate cancer (metastatic)

