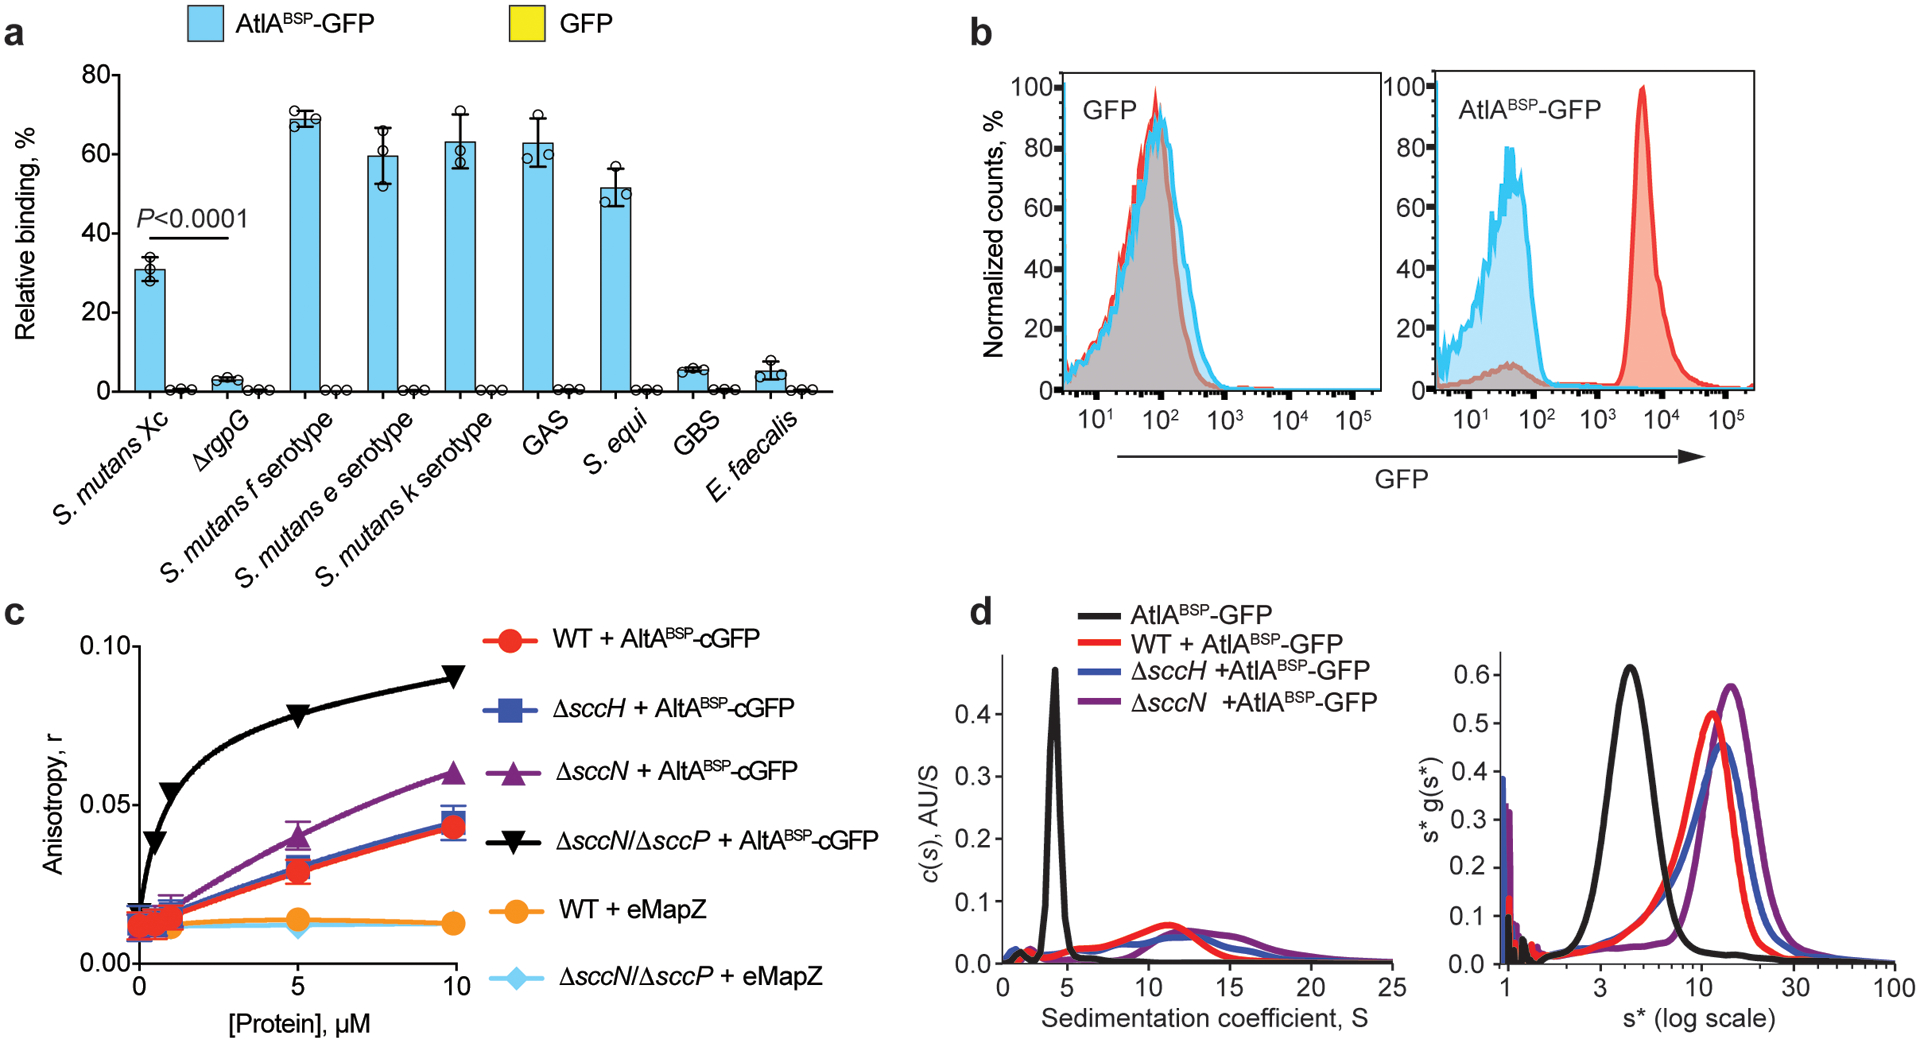
Fig. 4. AtlA binds to the polyrhamnose backbone of SCC.

(a) Co-sedimentation assay of AtlABSP-GFP and GFP with cell walls purified from S. mutans serotypes c, f, e and k, ΔrgpG, GAS, S. equi, GBS and E. faecalis. Data are presented as a percentage of fluorescence of the pellet normalized to the total fluorescence of the sample. Data are means ± S.D., n = 3 biologically independent experiments. P values were calculated by a one-way ANOVA, Tukey’s multiple comparisons. (b) AtlABSP-GFP binds to E. coli expressing polyrhamnose on the cell surface. Flow cytometry analysis of AtlABSP-GFP (right panel) and GFP (left panel) binding to the polyrhamnose-expressing E. coli (red) and its parental strain (blue). For flow cytometric analysis, at least 10,000 events were collected. Experiments depicted in b were performed independently three times and yielded the same results. Histograms of representative results are shown. (c) Fluorescence anisotropy of 0.5 μM ANDS-labeled SCC variants incubated with titrations of AtlABSP-cGFP or GFP-eMapZ. Binding of the ΔsccNΔsccP SCC to AtlABSP-GFP was fitted to a one-site total-binding model. Symbols and error bars represent the means ± S.D., n = 3 biologically independent experiments. (d) Analytical ultracentrifugation analysis of AtlABSP-GFP binding to SCCs purified from WT, ΔsccH and ΔsccN. The continuous c(s) distributions for 2.5 μM AtlABSP-GFP combined with 25 μM SCC variants (left panel). Plot of s*g(s*) vs. log(s*) using wide distribution analysis in SedAnal (right panel). Experiments depicted in d was performed independently twice and yielded the same results.
