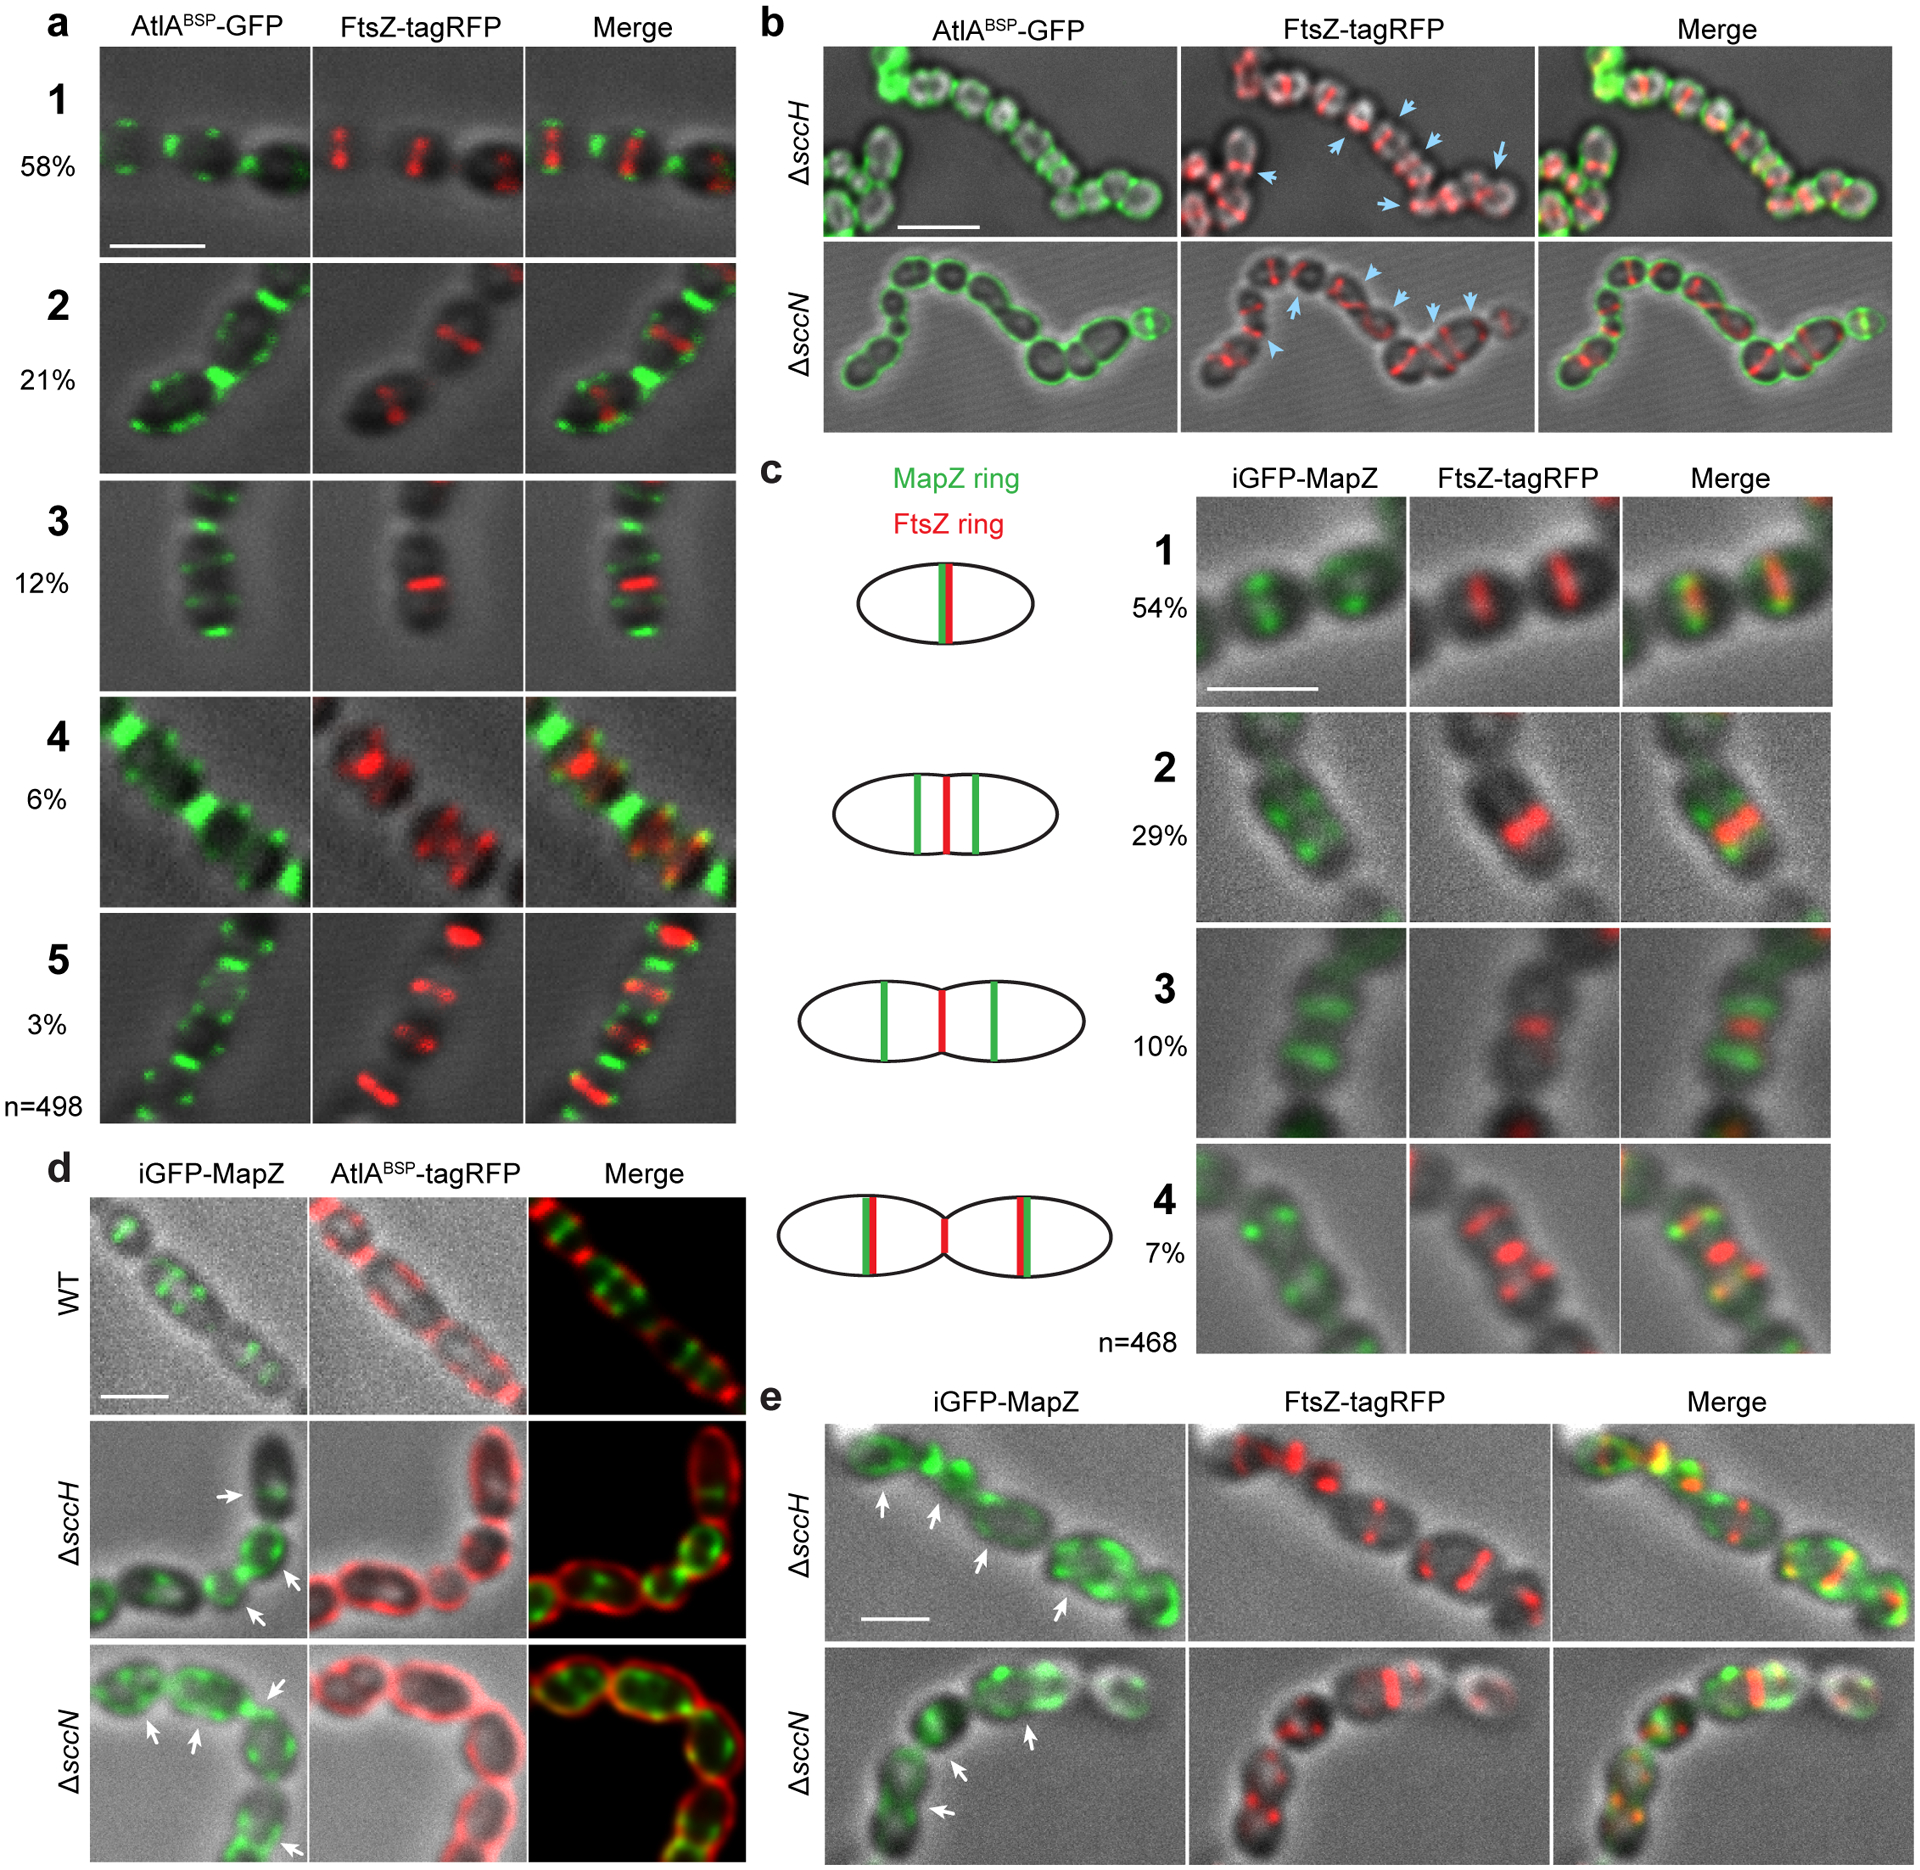
Fig. 5. Modifications of SCC guide the positioning of FtsZ- and MapZ-rings.

(a) Localization of FtsZ (middle panel, red) in WT cells expressing FtsZ-tagRFP labeled with AtlABSP-GFP (left panel, green) at different stages of the cell cycle (designated 1 to 5). The percentages of cells in each division stage (total 498 cells counted) are indicated in the far-left panel. (b) Localization of FtsZ (middle panel, red) in the ΔsccH and ΔsccN cells expressing FtsZ-tagRFP labeled with AtlABSP-GFP (left panel, green). Blue arrows indicate mislocalized Z-rings. (c) Localization of MapZ (left panels, green) and FtsZ (middle panels, red) in the WT cells expressing iGFP-mapZ/FtsZ-tagRFP at different stages of cell cycle designated 1 to 4. Schematic pictures (far-left panel) illustrate MapZ- and FtsZ-ring positions during different stages of the cell cycle. The percentages of cells in each division stage (total 468 cells counted) are indicated in the far-left panel. (d) Localization of MapZ (left panels, green) and SCCs labeled with AtlABSP-tagRFP (middle panels, red) in the WT, ΔsccH, and ΔsccN cells expressing iGFP-mapZ. White arrows show mislocalized MapZ. (e) Localization of MapZ (left panels, green) and FtsZ (middle panels, red) in the ΔsccH and ΔsccN cells expressing iGFP-mapZ/FtsZ-tagRFP. White arrows indicate mislocalized MapZ. Representative images from at least three independent experiments are shown in a, b, c, d and e. Images were deconvolved using Huygens Professional software, and represent DIC and fluorescence overlays except right panels in d (merge) that show an overlay of GFP and tagRFP signals. Right panels in a, b, c, and e (merge) show an overlay of DIC, GFP, and tagRFP signals. Supplementary Fig. 18 demonstrates representative raw and data-processed images of the WT, ΔsccH and ΔsccN cells expressing iGFP-mapZ/FtsZ-tagRFP. Scale bar is 1 μm in a, c, d and e, and 2 μm in b.
