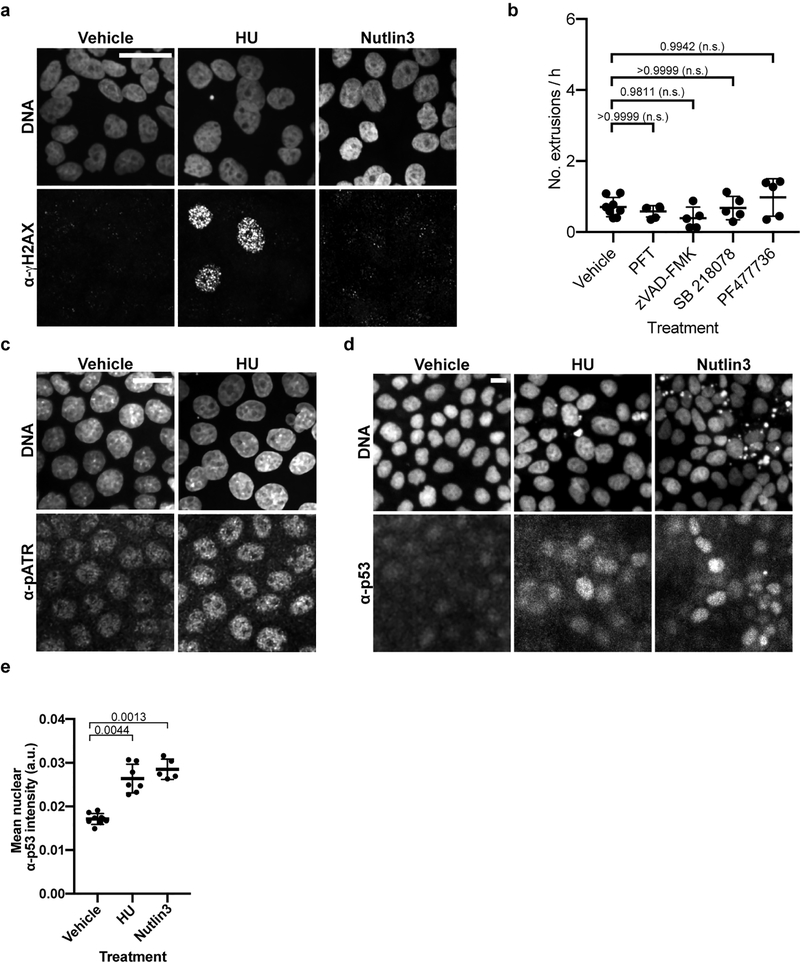
Extended Data Figure 6. Inhibitors of HU-induced replication-stress response and pan-caspase inhibitors do not alter stochastic cell extrusion.
a, c, d, Representative micrographs of (a) α-γH2AX, (c) α-pATR and (d) α-p53 immunofluorescence signal in (c) vehicle- or HU-treated MDCK-II cells, and (a, d) vehicle-, HU- or Nutlin3-treated MDCK-II cells. DNA is stained with Hoechst. Scale bars, 20 μm. b, Quantification of extrusions per h after the indicated treatment. n = 10, 6, 5, 5 and 5 (biological replicates) each for control, PFT, zVAD-FMK, SB 218078 and PF477736 treatments, respectively. Each data point represents a separate experiment. These data were collected and analyzed for statistical significance with the data in Fig. 4g. P values are indicated; n.s., not significant. e, Quantification of α-p53 immunofluorescence signal in vehicle-control-, HU-, or Nutlin-3-treated MDCK-II cells. n = 9, 7 and 5 (biological replicates) for vehicle, HU and Nutlin3, respectively. Each data point represents mean fluorescence intensity signal from one image of 100s of cells. Kruskal-Wallis one-way ANOVA followed by Dunn’s correction was performed. P values are indicated. Data in (b, e) are represented as mean ± S.D.

