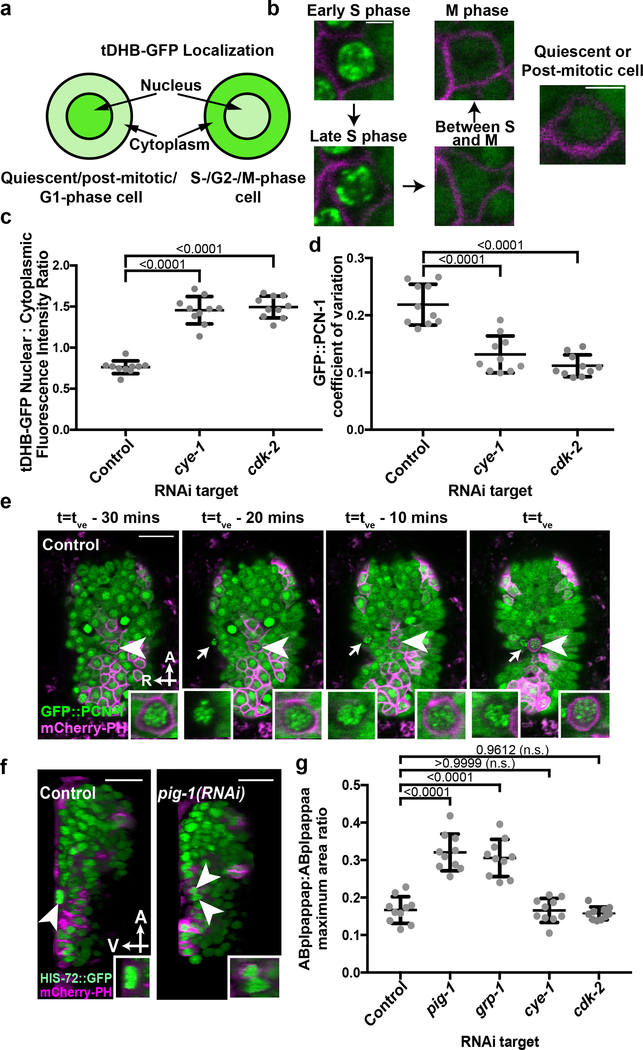
Figure 2. Cells undergoing extrusion arrest in S phase.
a, Relative nuclear/cytoplasmic localization of a tDHB-GFP fusion protein in the indicated cell-cycle phases10. b, localization pattern of GFP::PCN-1 in a typical C. elegans embryonic cell in the indicated cell-cycle phase. c, Nuclear:cytoplasmic ratio of tDHB-GFP fluorescence intensity in ABplpappap in heSi192[Peft-3::tDHB-GFP]; ced-3(lf); nIs861[Pegl-1::mCherry::PH] embryos after the indicated RNAi treatment. d, Quantification of the coefficient of variation of GFP::PCN-1 fluorescence intensity in ced-3(lf); isIs17[Ppie-1::GFP::pcn-1]; nIs861 embryos after indicated RNAi treatment. e, Time-lapse confocal fluorescence micrographs of GFP::PCN-1 fluorescence in ABplpappap (arrowhead) in ced-3(lf); isIs17; nIs861 embryos at the indicated times after treatment with control RNAi. Arrow, unidentified extruding cell. f, Micrographs of virtual lateral section of ced-3(lf); nIs861; stIs10026[his-72::GFP] embryos showing either ABplpappap (arrowhead) or its daughters (arrowheads) after indicated RNAi treatment. g, Quantification of the ratio of maximum area occupied by ABplpappap to that occupied by its sister, ABplpappaa, in ced-3(lf); ltIs44[Ppie-1::mCherry::PH]; stIs10026 embryos after the indicated RNAi treatment. Right inset, magnified view of ABplpappap or its daughters. Left inset in (e), magnified view of unidentified extruding cell. Scale bars, 10 μm in all micrographs except (b) and 2 μm in (b). A, anterior; R, right; V, ventral. n=10 embryos (biological replicates) for each RNAi treatment in (c, d, g). Data in (c, d, g) are represented as mean ± S.D. Ordinary one-way ANOVA with Dunnett’s correction for multiple comparisons (c, d, g). P values are indicated; n.s., not significant.

