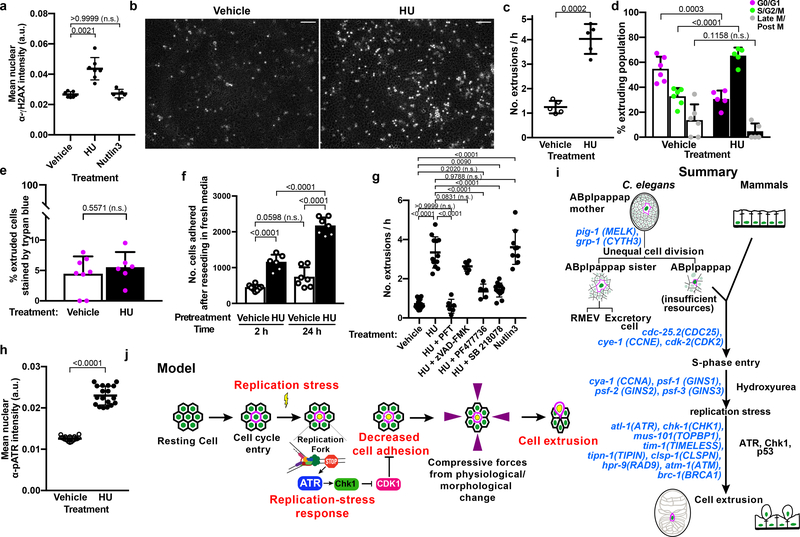
Figure 4. Replication stress promotes cell extrusion from a simple mammalian epithelial layer.
a, Quantification of α-γH2AX immunofluorescence signal in vehicle-control-, HU-, or Nutlin-3-treated MDCK-II cells. b, Representative micrographs of cells extruded (white rounded spots) from an MDCK-II monolayer after ~21 h of treatment with vehicle control (left) or HU (right). Scale bars, 100 μm. c, g, Quantification of extrusions per h after the indicated treatment. d, The cell-cycle phase of cells extruded after treatment with vehicle control or HU. e, Percentage of extruded cells staining with trypan blue after indicated treatment. f, Quantification of the number of HU-treated or vehicle-treated extruded cells that adhered at 2 h and 24 h after reseeding in fresh media. h, Quantification of α-pATR immunofluorescence signal in vehicle- or HU-treated MDCK-II cells, respectively. i, j, Summary and model of replication-stress induced cell extrusion. Each data point, separate experiment in (c-g); mean fluorescence intensity signal from one image of 100s of cells in (a, h). n = 7, 7 and 5 for vehicle, HU and Nutlin3, respectively, in (a); 5 each in (c); 6 for vehicle, 5 for HU in (d); 8 for vehicle, 6 for HU in (e); 8 for vehicle, 6 for HU at 2 h and 7 each at 24 h in (f); 13, 12, 6, 6, 5, 12 and 9 for vehicle, HU, HU+PFT, HU+zVAD-FMK, HU+PF477736, HU+SB218078, Nutlin-3, respectively in (g); 18 each in (h), all biologically independent. All data in (a, c-h) are represented as Mean ± S.D. Statistical analysis: Kruskal-Wallis one-way ANOVA followed by Dunn’s correction (a); two-tailed Welch’s t-test (c); Ordinary one-way ANOVA with Sidak’s correction (d, f, g); Mann-Whitney two-tailed test (e, h). P values are indicated; n.s., not significant.

