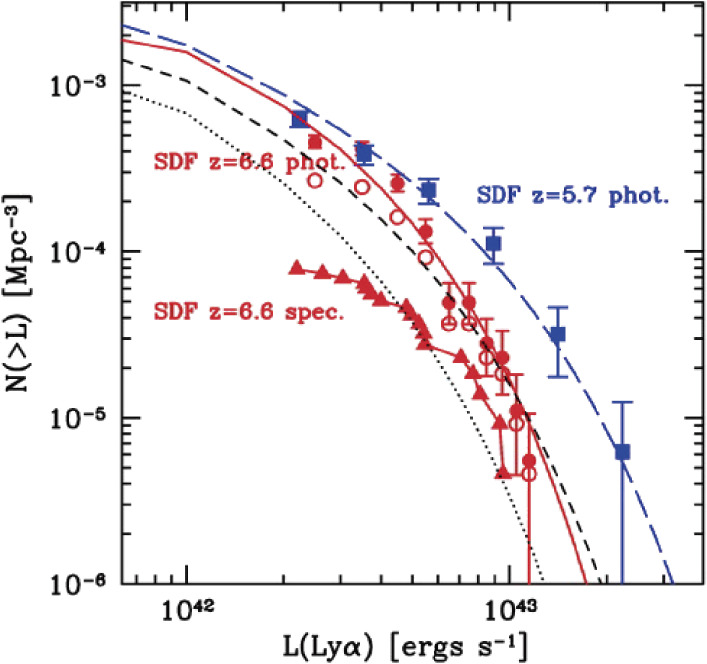
Figure 28.
Cumulative Lyman α luminosity functions, as observed in the SDF. The squares represent the photometric luminosity function for z = 5.7, and the long-dashed curve shows its fitted Schechter function. Open and filled circles show the observed and the completeness-corrected photometric luminosity functions for z = 6.6, and the solid curve shows its fitted Schechter function. The triangles are the spectroscopic luminosity function for z = 6.6.110)

