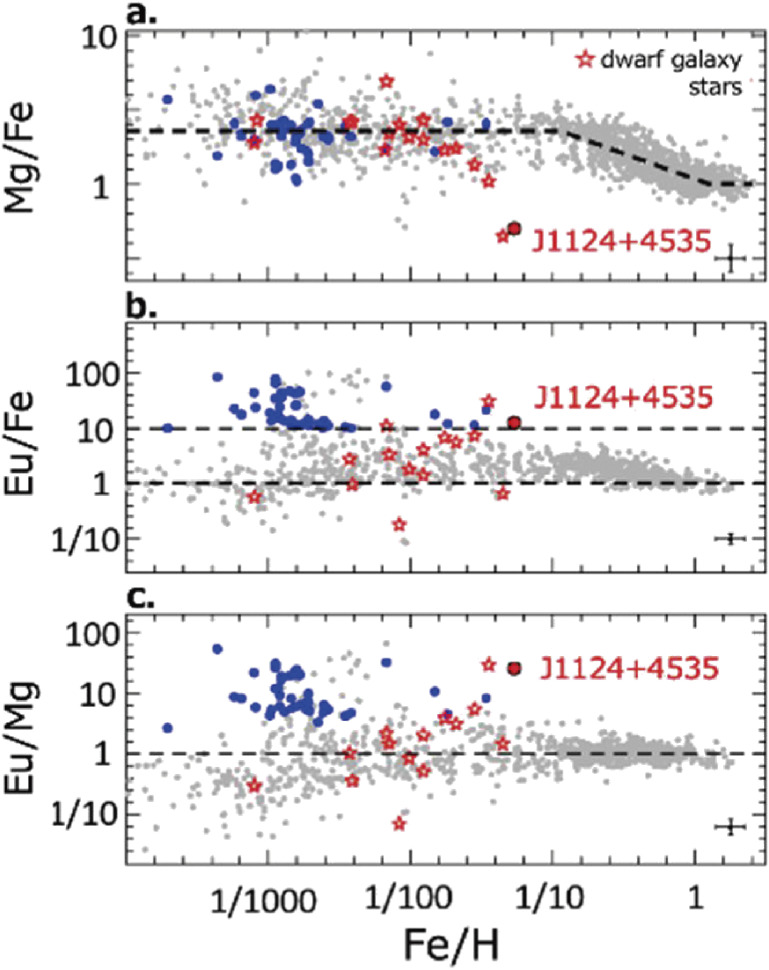
Figure 40.
Abundance ratios [Mg/Fe], [Eu/Fe], and [Eu/Mg] as shown in panels a, b, and c, respectively, of J1124+4535 (red circle) appear consistent with those measured for stars in Ursa Minor dwarf galaxy (red open star symbols).142) Figure was redrawn by W. Aoki.

