Figure 2.
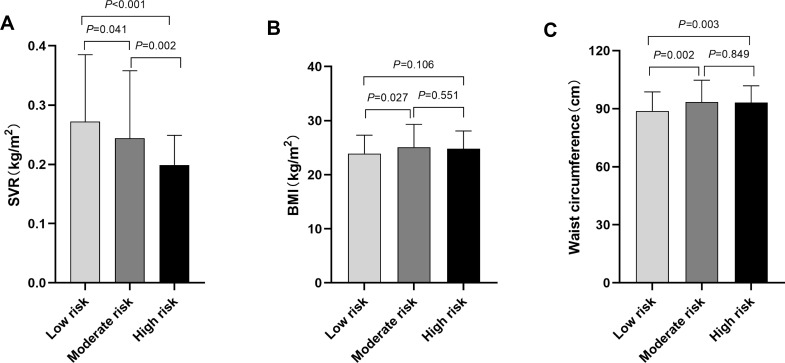
Comparison of SVR, BMI and waist circumference among T2DM patients with different CVD risks assessed by China-PAR risk model. (A) The comparison of SVR values among different CVD risk groups. The SVR value was 0.272±0.113kg/cm2 in China-PAR low-risk group, 0.244±0.114kg/cm2 in moderate-risk group, and 0.199±0.050kg/cm2 in the high-risk group. All pairwise comparisons of the SVR values among different CVD risk groups were statistically significant (All P<0.05). (B) The comparison of BMI among different CVD risk groups. The BMI was 23.9±3.4kg/cm2 in China-PAR low-risk group, 25.1±4.2kg/cm2 in moderate-risk group, and 24.8±3.3kg/cm2 in high-risk group. The BMI in low-risk group was lower than that in moderate-risk groups (P=0.027). No statistical differences were found between low- and high-risk group (P=0.106), or moderate- and high-risk group (P=0.551). (C) The comparison of waist circumference among different CVD risk groups. The waist circumference was 88.8±9.9cm in China-PAR low-risk group, 93.4±11.3cm in moderate-risk group, and 93.1±8.8cm in high-risk group. The waist circumference in low-risk group was significantly lower than that in moderate- and high-risk groups (Both P<0.05), while the difference between moderate- and high-risk group was not significant (P=0.849).
Note: China-PAR risk scores <5% was considered as low risk, 5–9.9% was moderate risk, ≥10% was high risk. P value for significance among different groups was determined by One-way ANOVA and the Post Hoc test was conducted using LSD test.

