
Figure 2.
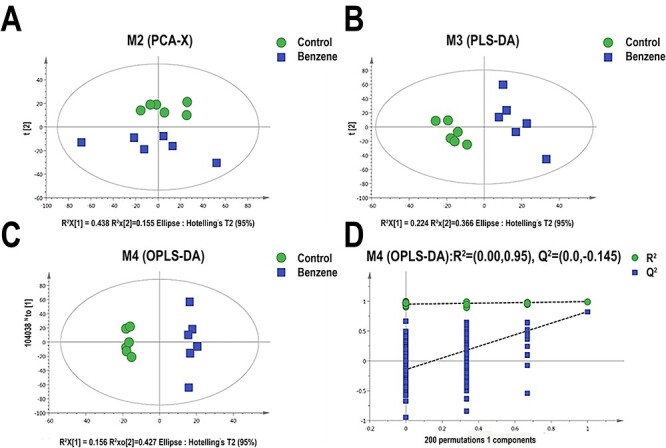
models derived from LC–MS dataset of BM cells from control and benzene group; (A) score plots of the PCA models; (B) supervised exclusion least squares discriminant analysis (PLS-DA); (C) orthogonal partial least squares-discriminant analysis (OPLS-DA); (D) permutation test (n = 200) validation plots of the OPLS-DA models; each point in the figure represents a single sample; green dots represent mice in control group; blue boxes represent samples in benzene exposure group.