
Figure 6.
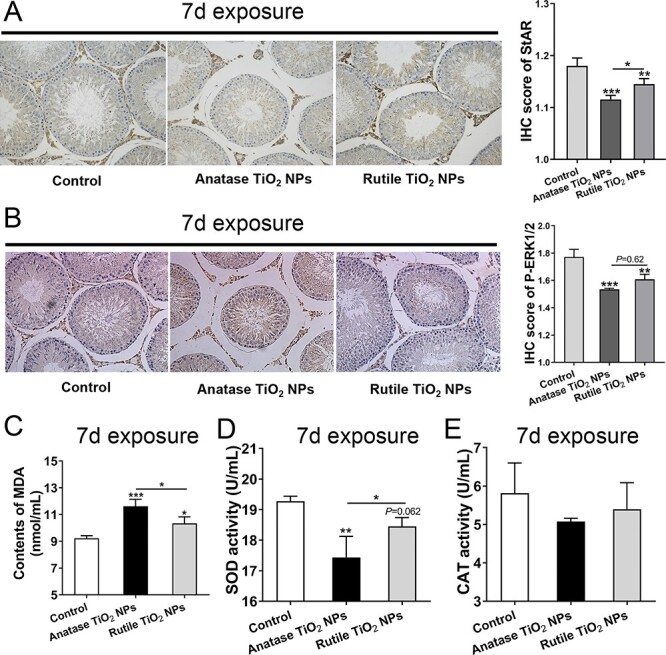
IHC analysis and ROS index determination. (A, B) IHC analysis of StAR and pERK1/2. (C–E) ROS index determination of MDA, SOD, and CAT in serum. Data are expressed as mean ± SD. *P < 0.05, **P<0.01, ***P < 0.001 compared with control.
Official websites use .gov
A
.gov website belongs to an official
government organization in the United States.
Secure .gov websites use HTTPS
A lock (
) or https:// means you've safely
connected to the .gov website. Share sensitive
information only on official, secure websites.
IHC analysis and ROS index determination. (A, B) IHC analysis of StAR and pERK1/2. (C–E) ROS index determination of MDA, SOD, and CAT in serum. Data are expressed as mean ± SD. *P < 0.05, **P<0.01, ***P < 0.001 compared with control.