
Figure 7 .
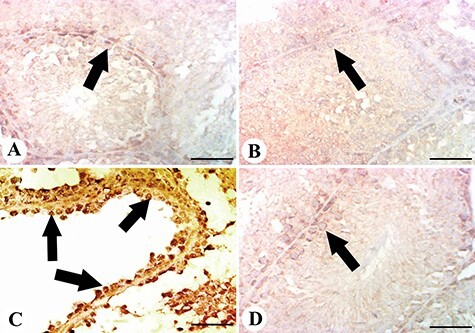
results of the immunohistochemical examination of COX-2. (A, B) testis of control and licorice groups showing faint and little expression of COX-2 among testicular cells; (C) testis of the MTX group showing increased Cox-2 expression in spermatogonial cells (arrows); (D) testis of licorice + MTX group showing mild COX-2 expression; scale bar = 50 μm.