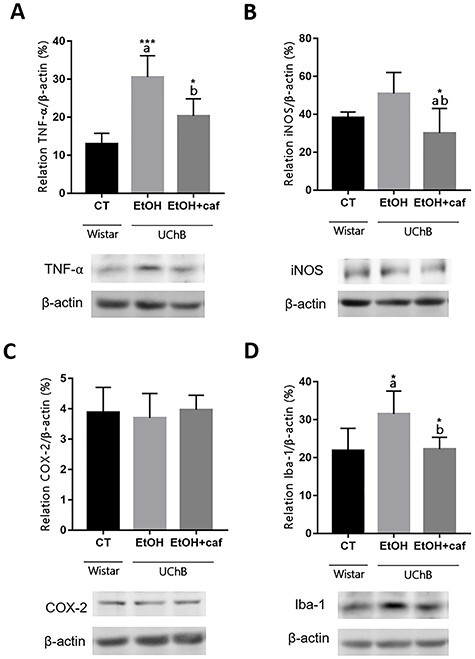
Figure 10.

Protein level analyses for TNF-α, iNOS, COX-2 and Iba-1 markers in the cerebellum. Data are expressed as the mean ± standard deviation. Letters in the top of the column indicate statistical differences: “a” indicates significant statistical difference from the Control group; “b” indicates significant statistical difference from the Ethanol group. *P < 0.05, **P < 0.01 and ***P < 0.001.
