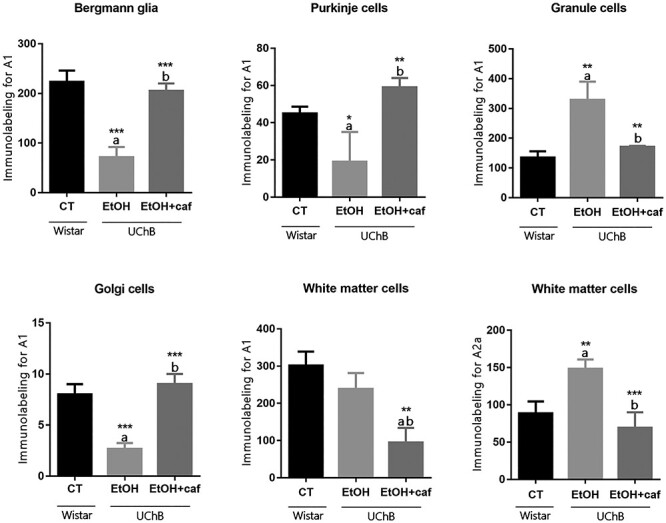
Figure 3.

Immunohistochemistry graphs for adenosinergic receptors A1 and A2a for the analyzed cerebellar cell types. Note that the A2a staining was quantitatively measured only for White matter cells. Letters in the top of the column indicate statistical differences: “a” indicates significant statistical difference from the Control group; “b” indicates significant statistical difference from the Ethanol group. *P < 0.05, **P < 0.01 and ***P < 0.001.
