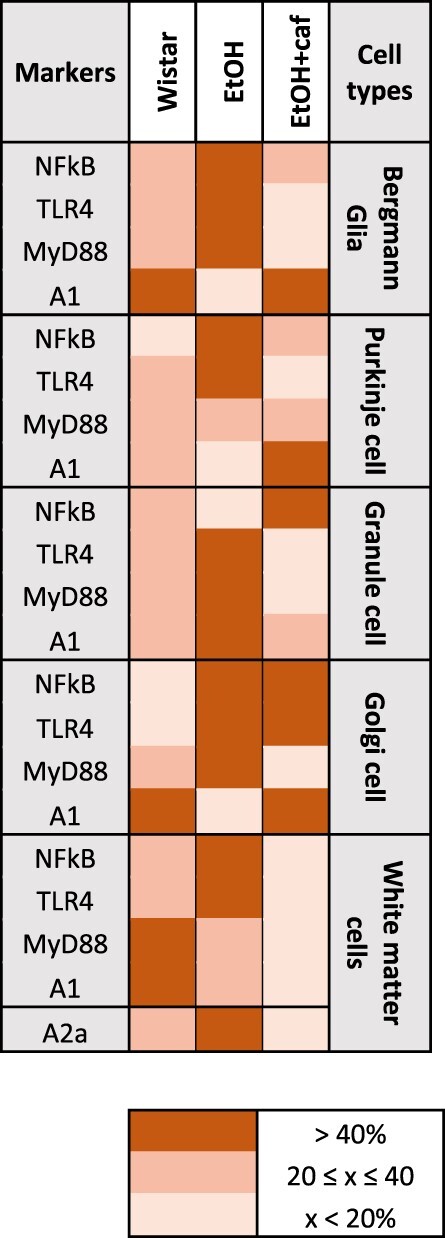
Table 1.
Immunohistochemistry frequency of staining among the groups, according to cerebellar cell types

|
In the columns, the analyzed markers are specified for each cerebellar cell type. According to frequency of staining, a color was attributed to the marker and correspondent group, following the legend. In short, the darker the color, the greater the marking.
