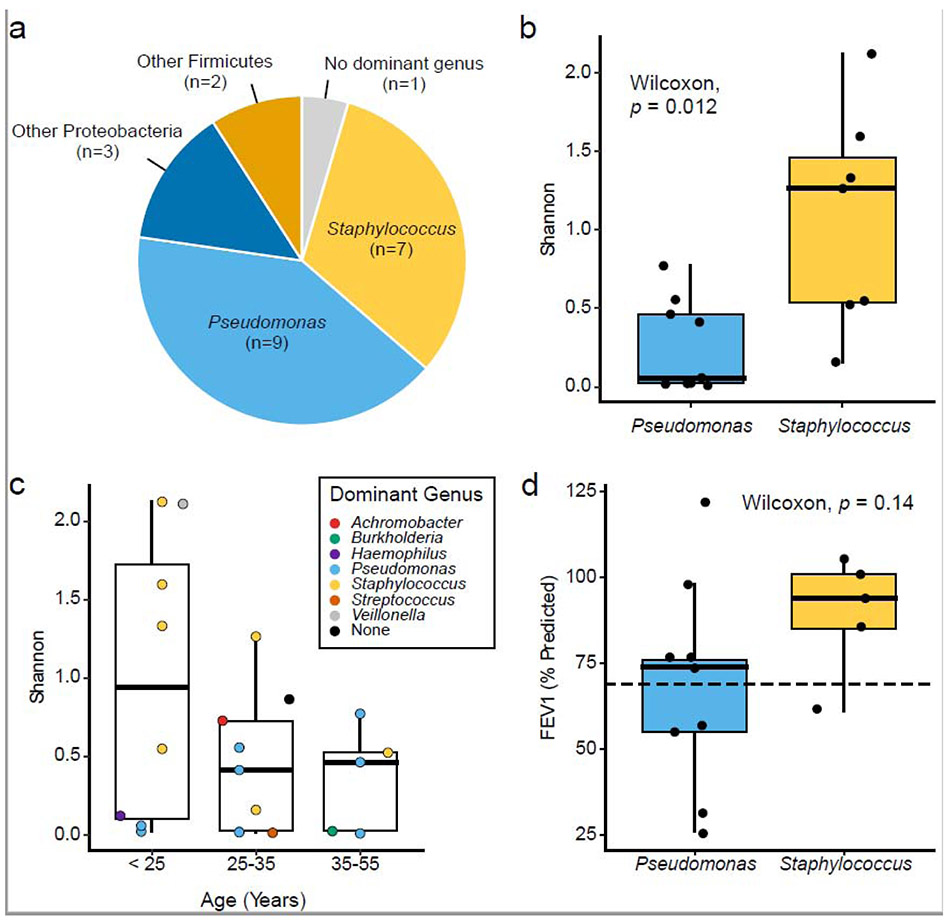
Figure 2. Shannon diversity and bacterial dominance.
(a) Number and proportion of samples with a dominant genus present (n = 22). (b) Shannon diversity compared between Pseudomonas or Staphylococcus dominance (Wilcoxon test, p=0.012). (c) Shannon diversity relative to CF patient age (Kruskal-Wallis, p=0.3). Points are colored by dominant genus. (d) Lung function measured by FEV1% (% predicted) compared between dominant genera (Wilcoxon test, p=0.2). Dashed line denotes level below which CF disease is considered to be moderate to severe.

