
Figure 1. Restricted quadratic spline models of hazard ratios (HRs) and 95% confidence intervals of heart disease mortality for a one-unit increase in urinary total arsenic and DMA concentrations (μg/L), restricted to all participants (Panel A; N=4,990, cases= 77) and non-Hispanic white participants (Panel B; N=2,441, cases = 50) with arsenobetaine <1.2 μg/L, NHANES 2003-2014.
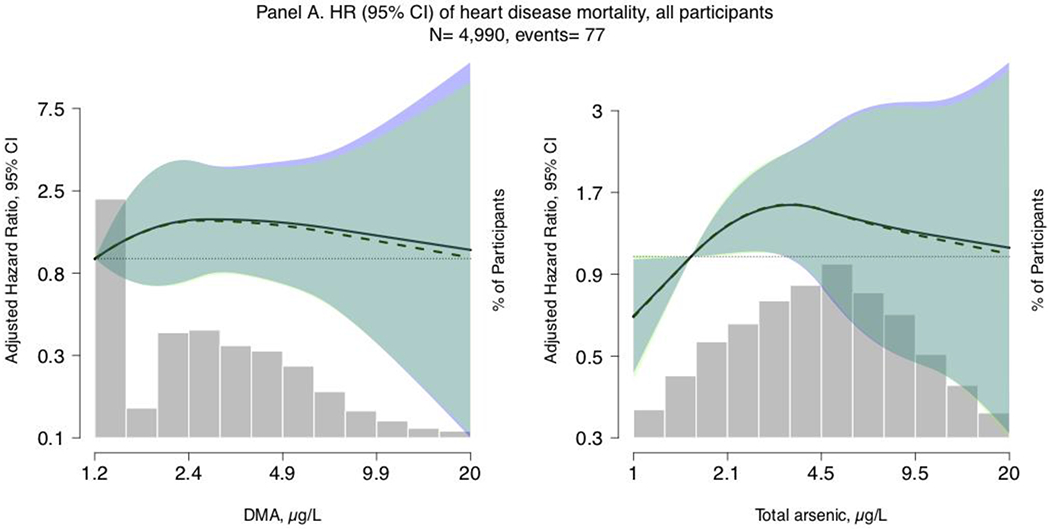
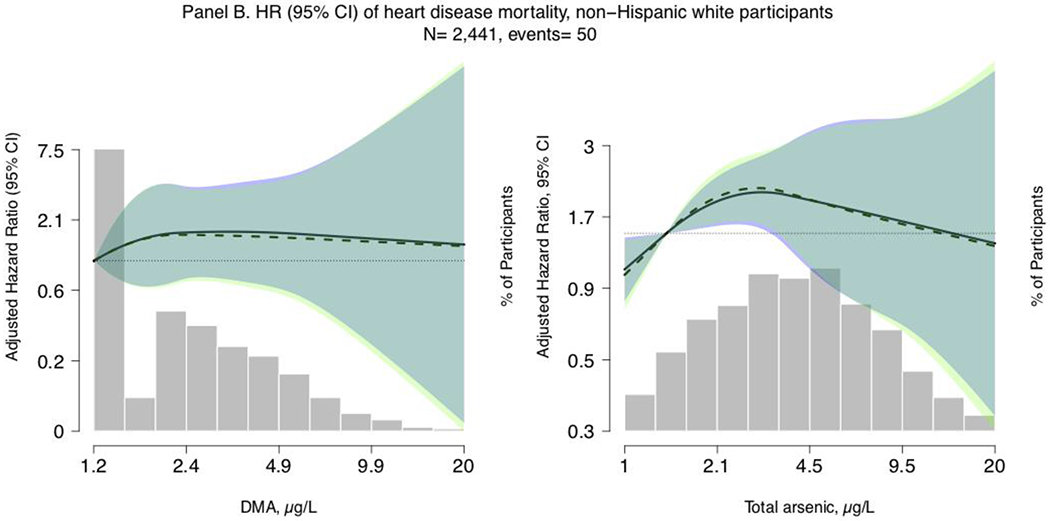
Lines represent the hazard ratio (left y-axis) based on restricted quadratic spline models with knots at the 10th, 50th, and 90th percentiles of urinary arsenic concentrations (x-axis), with the reference set at the 10th percentile. Shaded rectangles represent the proportion of the population (right y-axis) with urinary arsenic concentrations at a given point on the urinary arsenic distribution (x-axis). Solid lines (HRs) and blue areas surrounding the solid lines (95% confidence interval) correspond to Model 1, which is adjusted for age (age from baseline modeled as time metric), sex (male/female), race/ethnicity (Mexican American/Non-Hispanic White/Non-Hispanic Black/Other, including Multiple Races), estimated glomerular filtration rate (continuous, using CKD-Epi formula), and urinary creatinine (mg/dL, continuous, to account for urine dilution). Dashed lines (HRs) and light green areas surrounding the dashed lines (95% confidence interval) correspond to Model 2, which is further adjusted for education (≤ 12 years / >12 years), body mass index (continuous), total blood cholesterol (mg/dL, continuous), serum cotinine (ng/mL, continuous), and self-reported past 24-hour intake of seafood and fish (g/kg bodyweight). Dark green areas represent overlap in the 95% confidence intervals between Models 1 and 2.