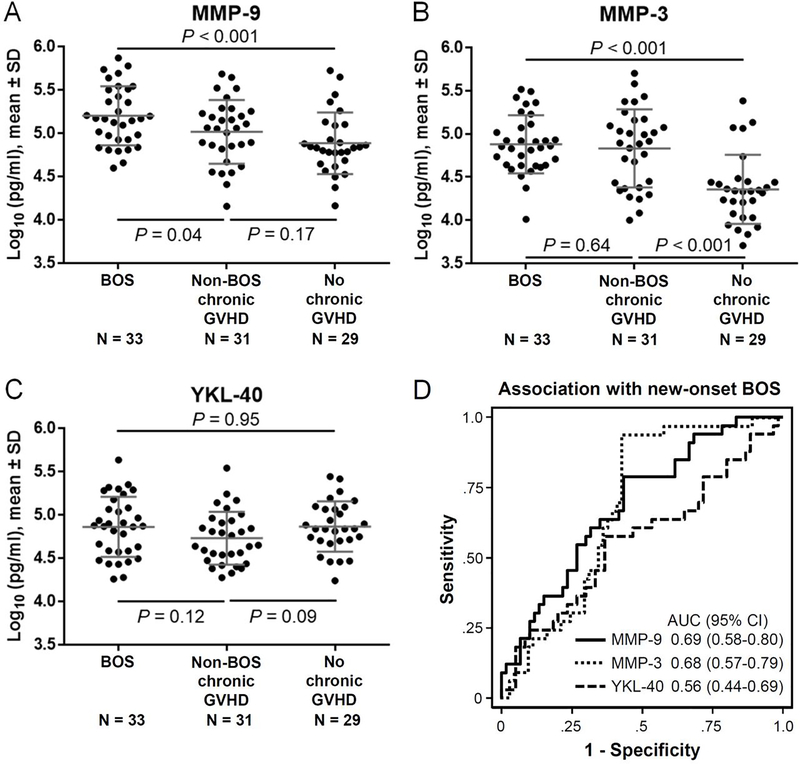
Figure 2. Diagnostic relevance.
Plasma concentrations were compared in BOS cases and controls for (A) MMP-9, (B) MMP-3 and (C) YKL-40. (D) Receiver operating characteristic curves for association with diagnosis of new-onset BOS. The horizontal lines indicate means, and error bars indicate standard deviations. P values were derived from t-test. SD, standard deviation; AUC, area under the curve; CI, confidence interval.

