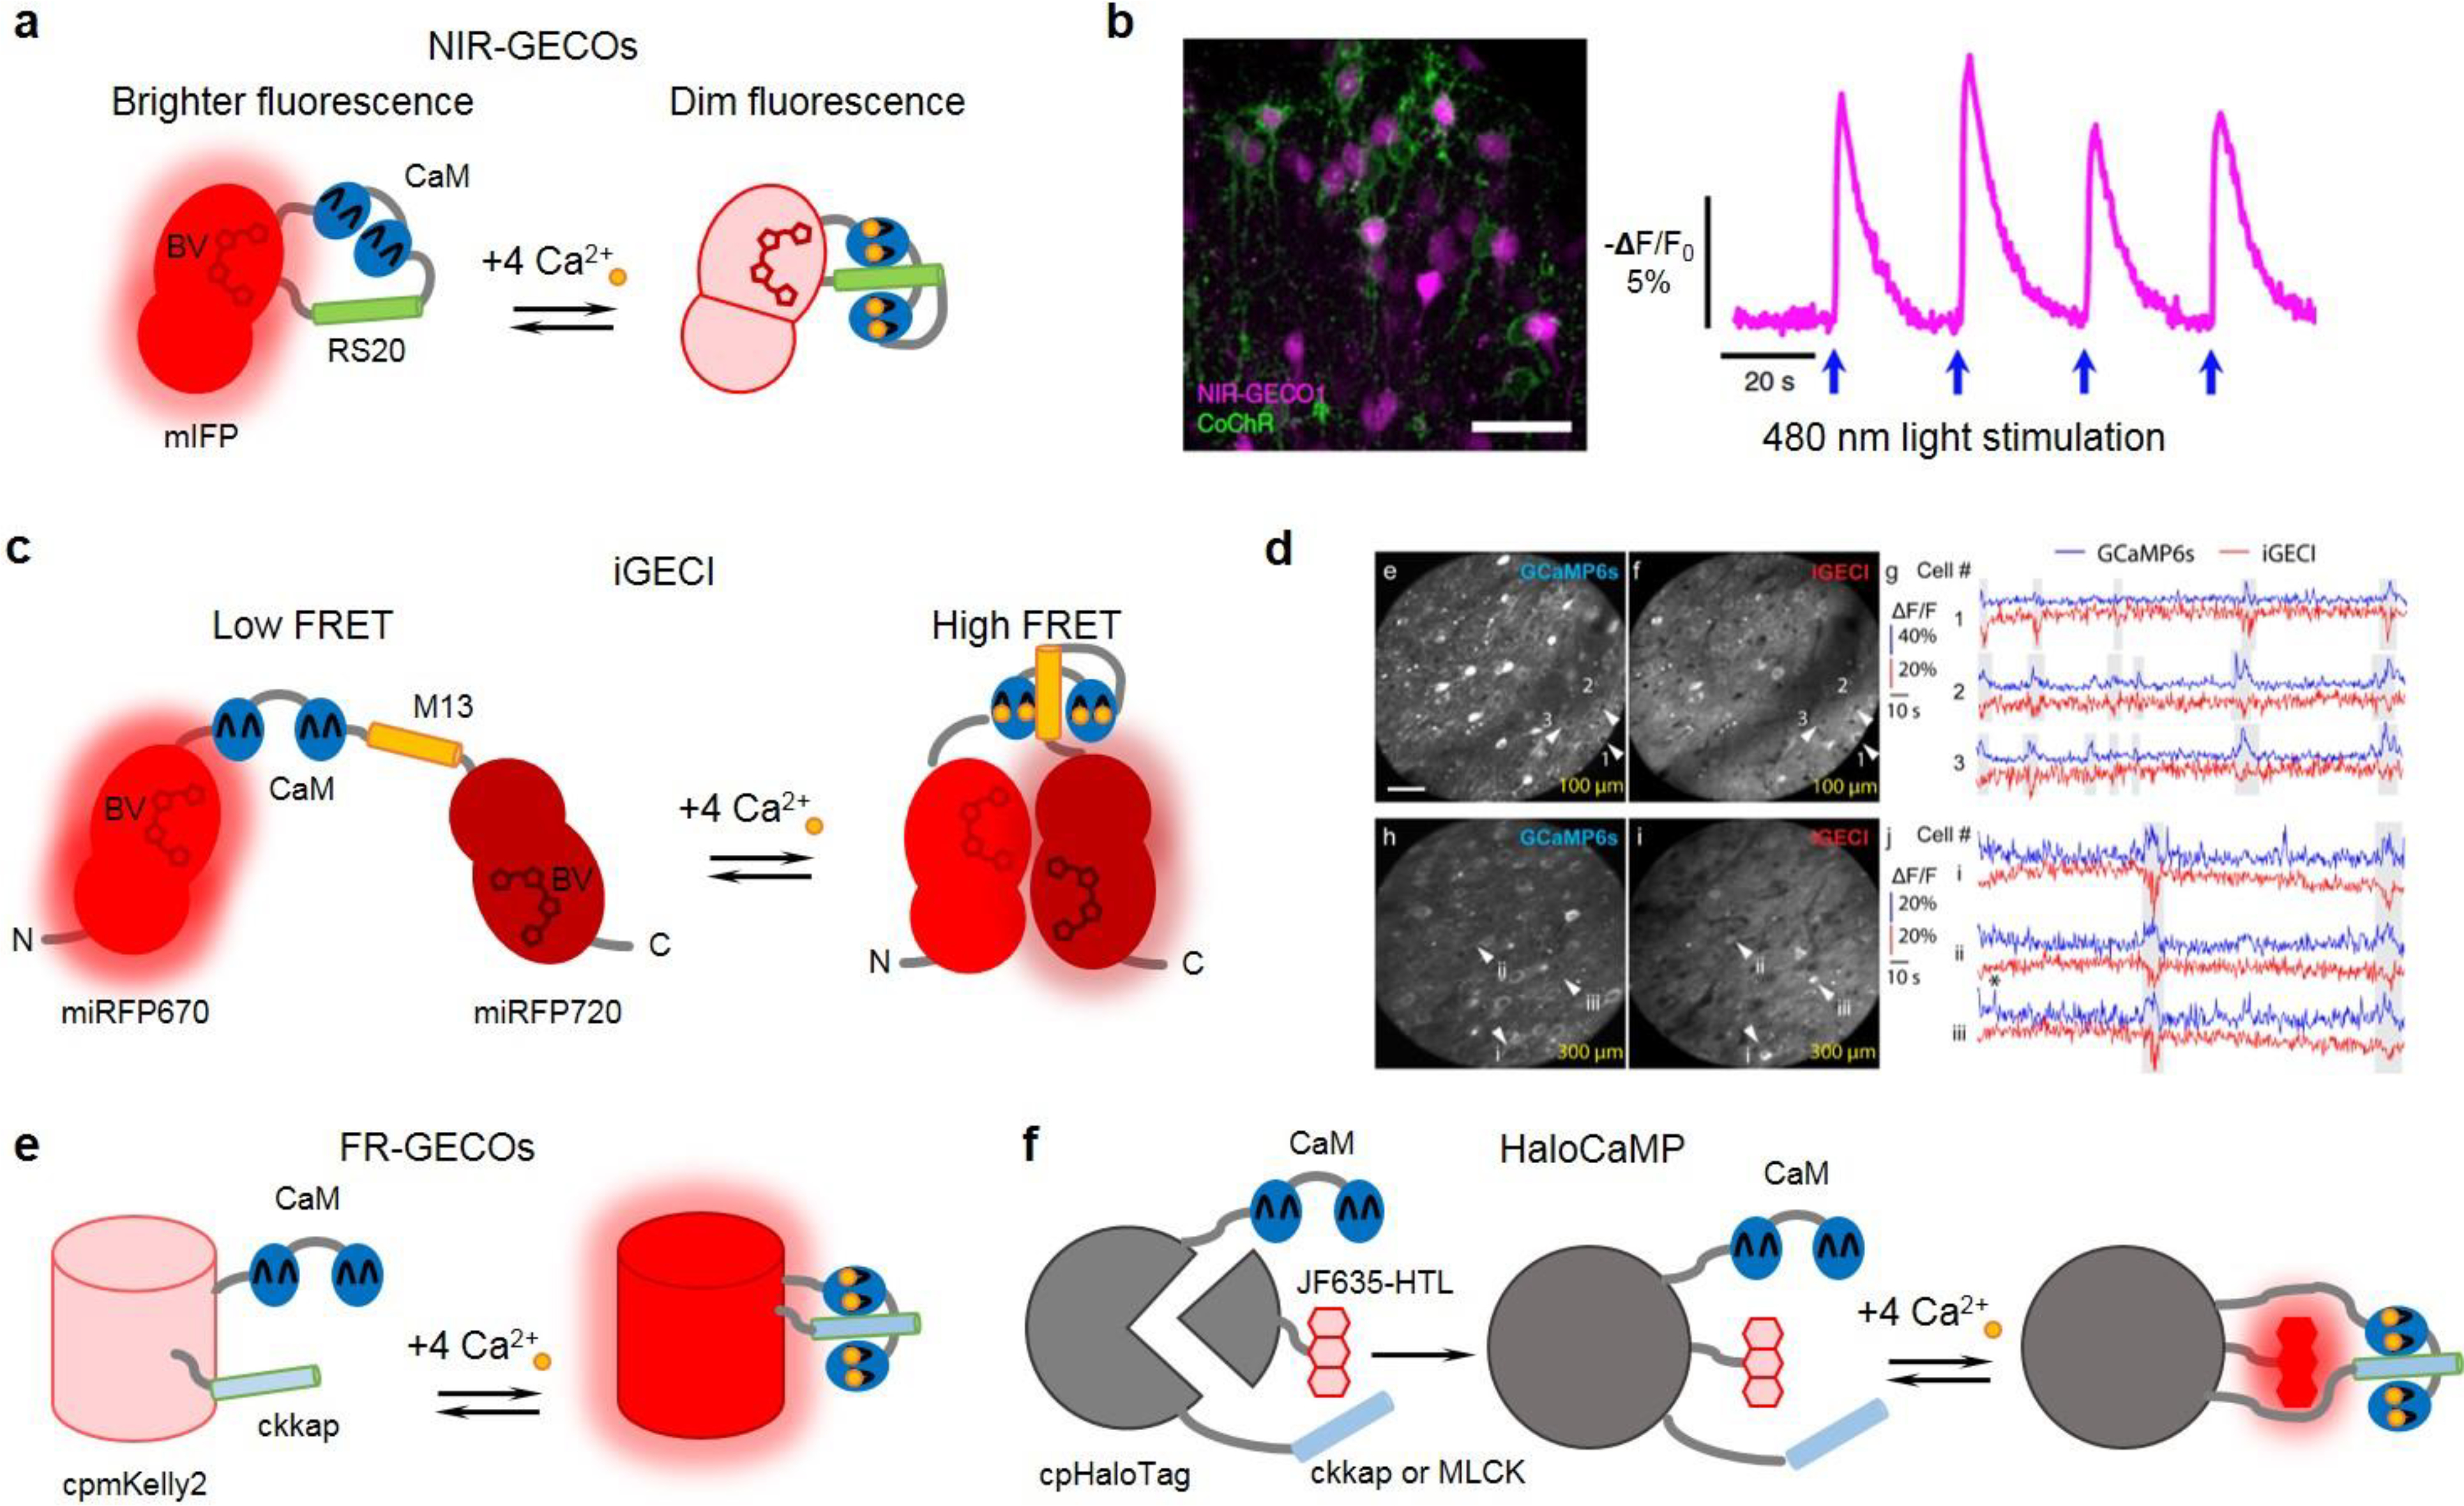
Figure 1. Near-infrared and far-red GECIs and their representative applications.

(a) Schematics of NIR-GECO series of indicators. (b) All-optical control and readout of neuronal activity. (left) Confocal images of neurons co-expressing NIR-GECO1 (magenta pseudocolor) and CoChR-mTagBFP2-Kv2.2motif (green pseudocolor) in a brain section. (right) NIR-GECO1 responses to CoChR activation. Adapted, with permission, from26 (c) Schematics of iGECI FRET based indicator. (d) Two-photon imaging of spontaneous neuronal activity with iGECI in vivo. (left) Two-photon fluorescence images of neurons in the mouse primary visual cortex at 100 μm (top) and 300 μm (bottom) below dura. Scale bar: 50 μm. (right) Example ΔF/F calcium transients for neurons co-expressing GCaMP6s and iGECI at 100 μm (top, white arrowheads) and 300 μm (bottom, white arrowheads). In all experiments, no exogenous BV was supplied. Adapted, with permission, from27. (e) Schematics of FR-GECO series of indicators. (f) Schematics of HaloCaMP1 series of indicators. (a, c, e, f) CaM: calmodulin; RS20, M13, ckkap or MLCK: CaM binding peptides; BV: biliverdin; cpmKelly2 and cpHaloTag: circular permutant mKelly2 FP and HaloTag; JF635-HTL: synthetic rhodamine dye
