
Fig. 1.
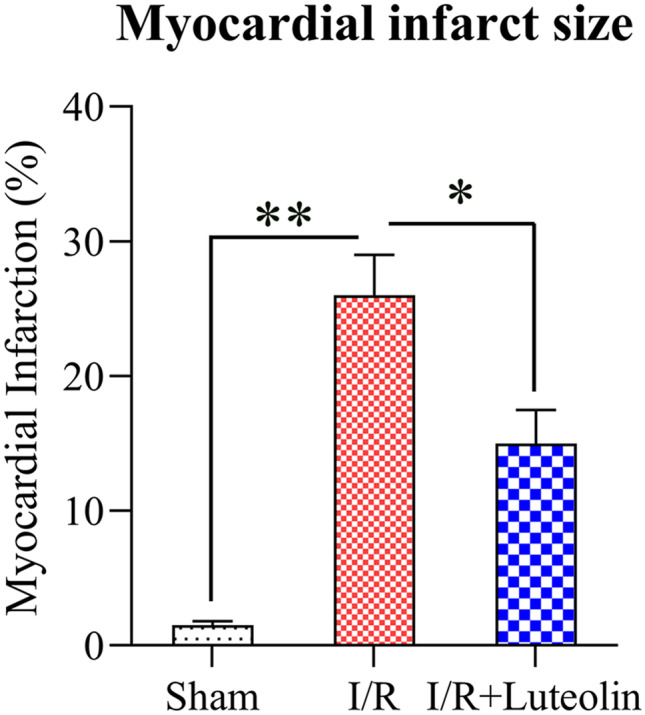
Cardiac MI area in I/R. Myocardial necrosis was evaluated by TTC staining. A Sham group, B model group, C Lut group; bar chart represents the ratio of cardiac MI area. N = 3. Data are expressed as M ± SD. Compared with indicated group, the differences were significant (p < 0.05; p < 0.01).