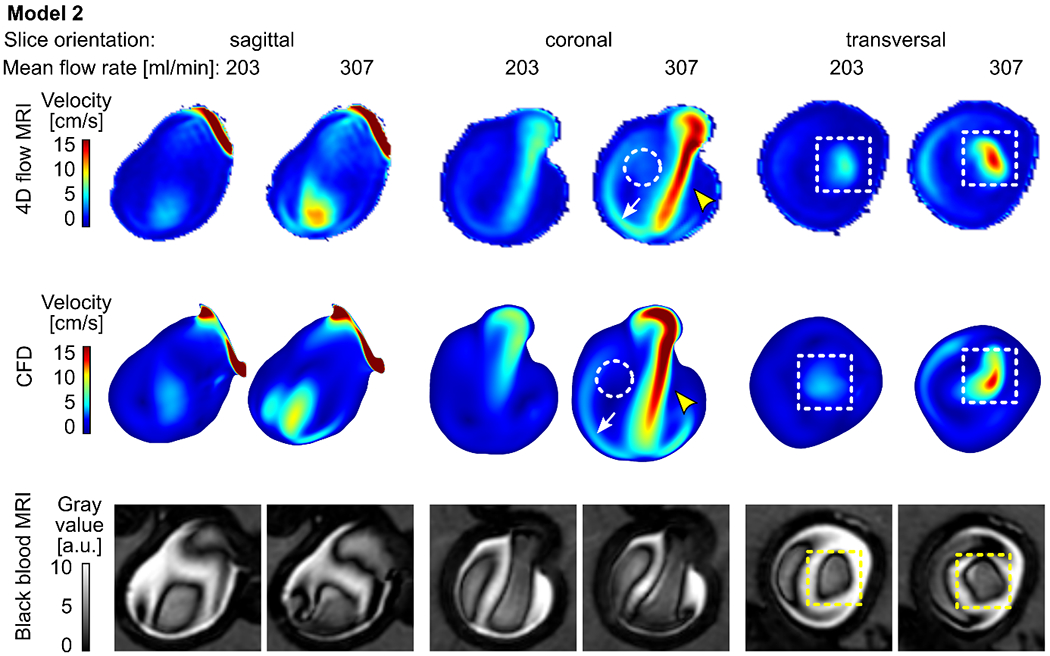
Figure 4.

Time-averaged velocity magnitude acquired with 4D flow MRI (top) and calculated with CFD (middle) and the corresponding black-blood MR images (bottom, after administering contrast agent, with 0.7 mm3 isotropic voxel size) for model 2 supplied with 203 and 307 ml/min average flow rate. Note that the 4D flow MRI and CFD revealed similar flow patterns: a strong forward flow (yellow arrowheads), reverse flow along the aneurysm wall (white arrows), and the region of low velocity between forward and reverse flow (dashed circles). Areas of high velocity were colocalized with low-signal areas (dashed squares).
