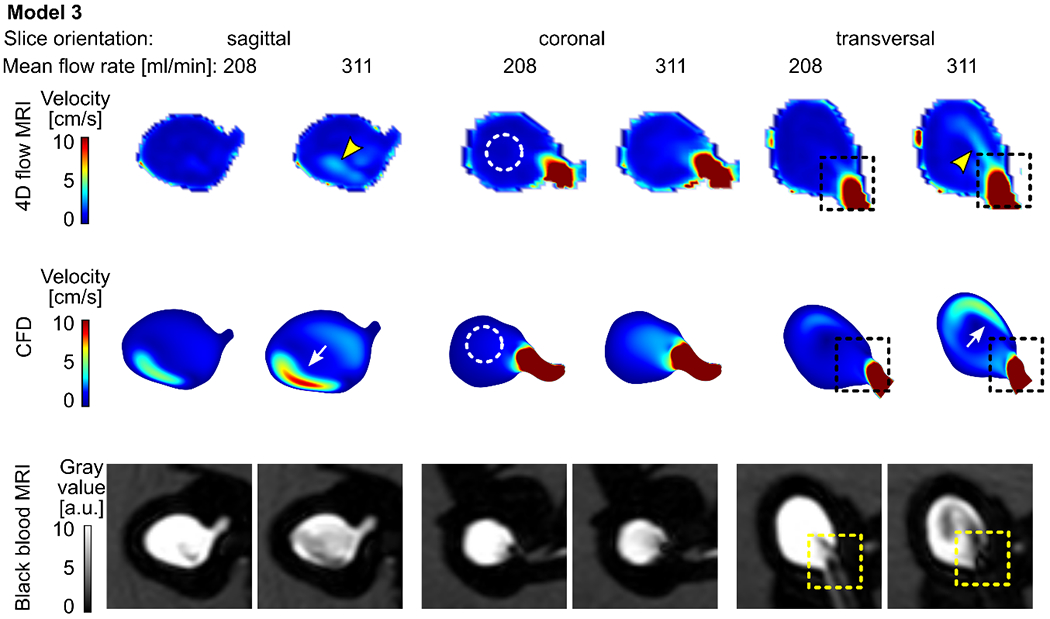
Figure 5.

Time-averaged velocity magnitude acquired with 4D flow MRI (top) and calculated with CFD (middle) and the corresponding black-blood MR images (bottom, after administering contrast agent, with 0.7 mm3 isotropic voxel size) for model 3 supplied with 208 and 311 ml/min average flow rate. Note that the 4D flow MRI and CFD both revealed centrally located slow-flow areas (dashed circles). However, considerable differences among the modalities are present: higher flow velocities adjacent to the wall were detected by CFD (white arrows), while 4D flow MRI demonstrated a similar flow pattern removed from the wall (yellow arrowheads). Still, the areas of high velocity were colocalized with low-signal areas (dashed squares).
