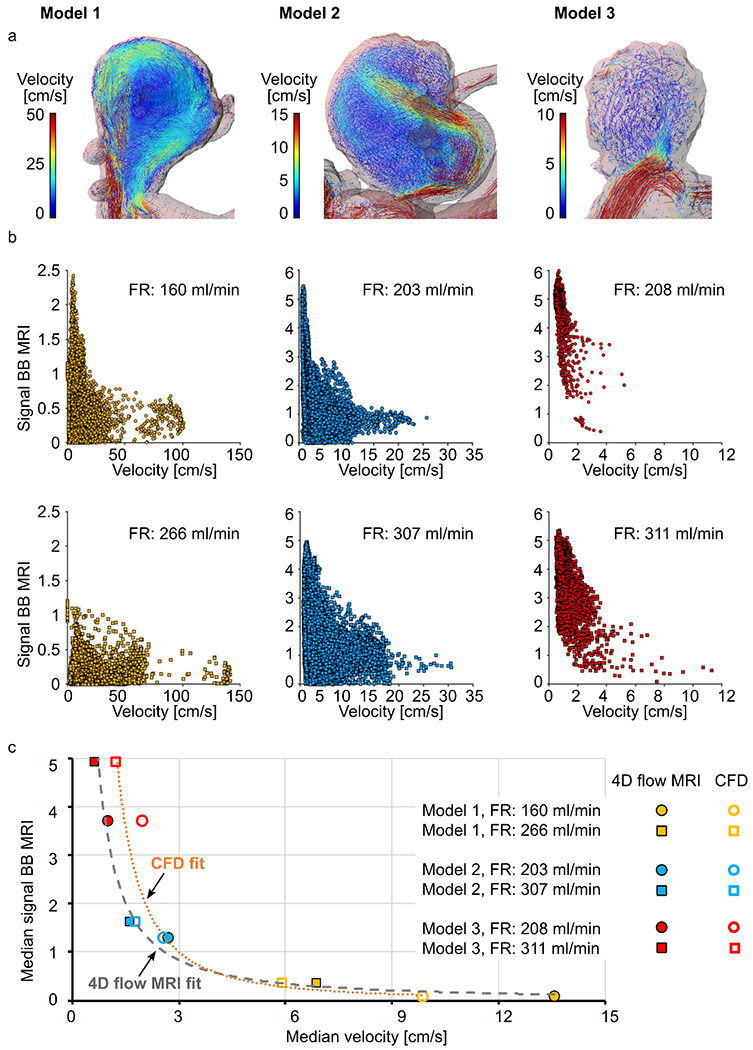
Figure 6.

Flow patterns in models 1-3 visualized by velocity pathlines; note that the velocity scales are different for models 1-3 to magnify the flow patterns at each geometry (a), and distribution of time-averaged velocity magnitude and black-blood MRI signal intensities in the aneurysm lumen visualized with scatter plots (b). Note the different scales of a and b. The median values of time-averaged voxel-wise velocity and BB MRI signal intensities fitted with a potential function (c). High time-averaged velocity magnitude was observed only together with low-signal areas.
