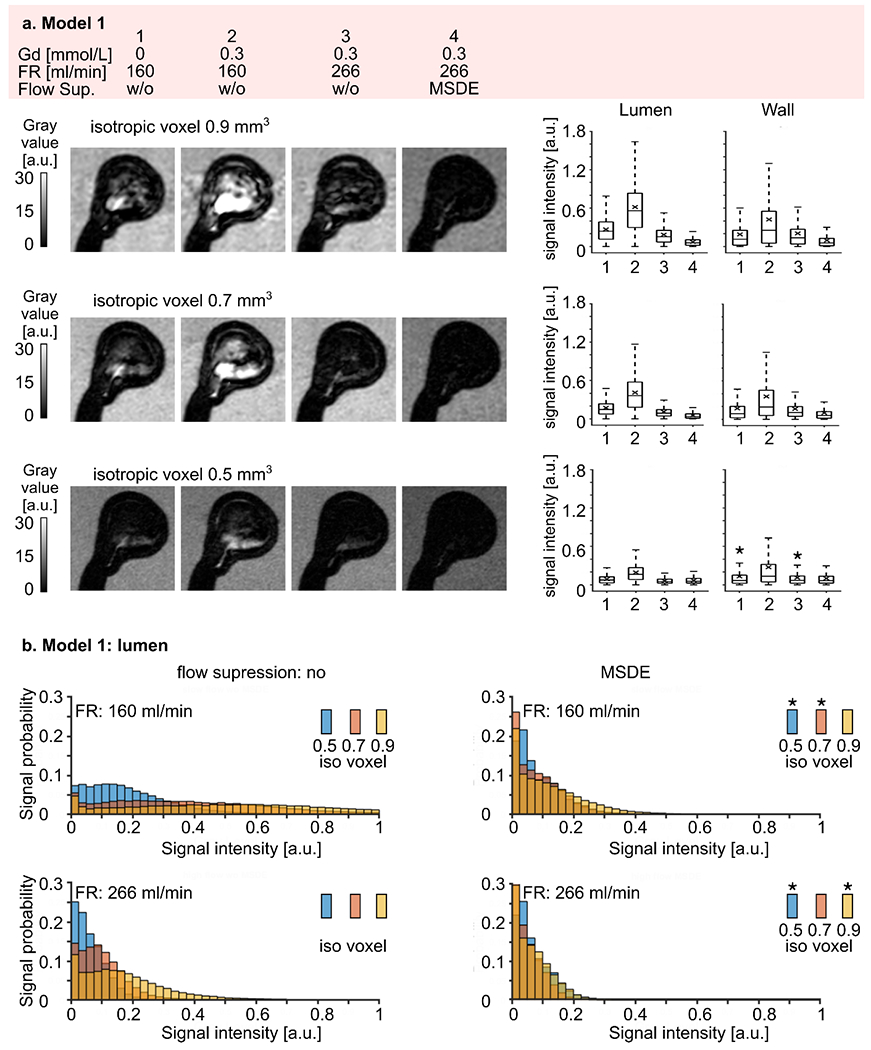
Figure 7.

(a) Representative black-blood MR images of model 1 (high intra-aneurysmal flow) before (1) and after (2-4) administration of contrast agent, with low (1-2) and high (3-4) flow rates and additional flow suppression (MSDE, 4). The experiment was repeated with three different voxel sizes 0.9, 0.7, and 0.5 mm3 (from top to bottom). Note that the black-blood effect was more pronounced with smaller voxel sizes. Signal intensities were measured in the lumen and at the wall (right). Signal intensities increased when contrast agent was added and decreased with higher flow rates and with MSDE. The quantitative results were visualized with box plots, with the whiskers representing the upper and lower quartile. Asterisks above the box indicate a p-value > 0.01.
(b) Distribution of black-blood MRI signal intensity within the aneurysm lumen of model 1 visualized by histograms where the bar height represents the probability of finding a particular signal value in an aneurysm sac depending on the voxel size. Note that the probability of having a low signal intensity was higher when a smaller voxel size was used. Asterisks indicate a p-value > 0.01.
