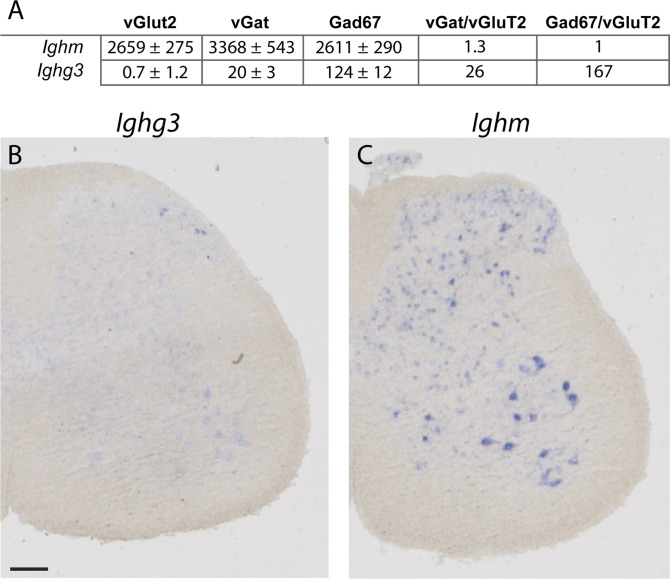
Figure 1. Spinal expression of Ighg3 and Ighm.
(A) Expression of Ighm and Ighg3 depicted as normalized read count. Read counts were determined in RNA samples extracted from excitatory (vGluT2+), inhibitory (vGAT+), and a subset of inhibitory (Gad67+) spinal neurons after performing RNA sequencing (Das Gupta et al, 2021). Also depicted are differences in expression (fold change) when comparing vGAT versus vGluT2 and Gad67 versus vGluT2 samples. (B, C) Expression pattern analysis of Ighg3 (B) and Ighm (C) in adult spinal cord sections of the mouse using in situ hybridization. Scale bar: 100 µm.

